🚨 NETFLIX INC, 🔗 AT&T INC., 🔗 CSX CORP, 🔗 United Airlines Holdings, Inc., 🔗 WESTINGHOUSE AIR BRAKE TECHNOLOGIES CORP

|

|
|
Daily Summary
|
October 21, 2026
|
Welcome to your daily digest. Today we are analyzing the latest income statements and filings from:
|
|
|
|
🔍 Deep Dive: NETFLIX INC
Period Ending 2026-09-30
|
|
🚨 Price Alert: The stock price dropped by 7.69% around the earning call.
|
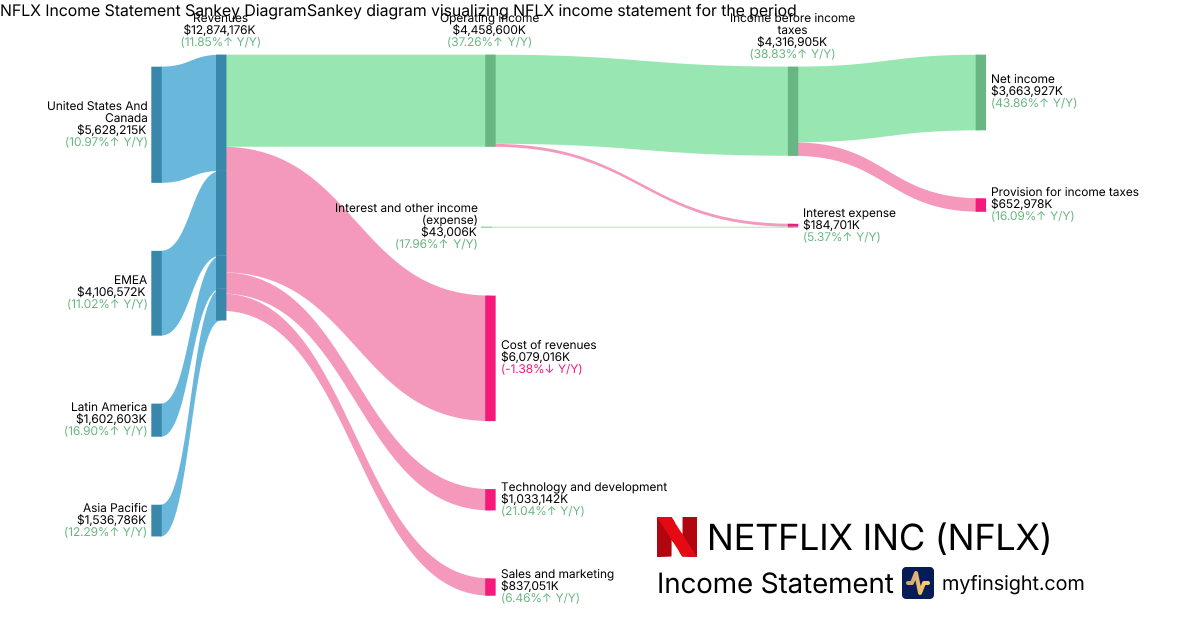
Netflix (NFLX) stock experienced significant volatility around its Q3 2026 earnings call, primarily driven by a mixed outlook despite strong quarterly financial performance. While the company reported solid revenue growth and a substantial increase in net income, investor concerns were fueled by a reduced full-year advertising revenue forecast and cautious Q4 guidance.
Key Factors Contributing to Volatility:
- Robust Q3 Financials: Netflix reported Q3 revenues of approximately $12.9 billion, with net income surging to $3.66 billion and operating income reaching $4.46 billion.
- Reduced Advertising Revenue Forecast: A significant driver of negative sentiment was the downward revision of the 2026 advertising revenue target from $3.0 billion to $2.7 billion due to delays in product rollouts and partner integrations.
- Slowing Revenue Growth Rate: Despite meeting revenue estimates, the 11.8% year-over-year revenue growth in Q3 2026 was the slowest recorded in nearly three years, raising concerns about the pace of future expansion.
- Conservative Q4 Guidance: Netflix's guidance for Q4 2026 fell slightly below analyst expectations for both revenue and diluted earnings per share, contributing to investor caution.
- Strong Subscriber and Ad-Tier Performance: The company successfully added 5.1 million paid subscribers, exceeding analyst estimates, with its ad-supported tier demonstrating strong growth and accounting for over half of all new sign-ups in relevant markets.
|
|
Revenue
$12.9B
|
|
Net Income
$3.66B
|
|
Net Margin
28.46%
|
|
🔍 Deep Dive: AT&T INC.
Period Ending 2026-09-30
|
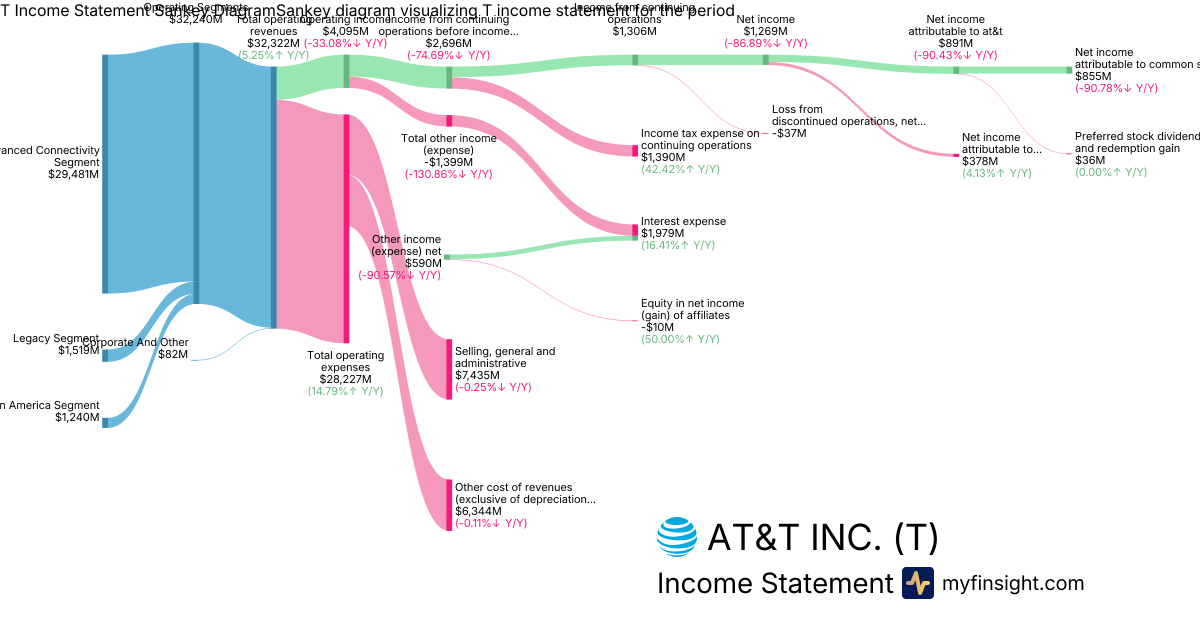
- Top-line Growth Driven by Advanced Connectivity: AT&T reported total operating revenues of $32.3 billion, up 5.3% year-over-year, with the Advanced Connectivity Segment contributing significantly with $29.5 billion in revenues. The company added over 1 million Advanced Connectivity customers for the second consecutive quarter, driven by net adds across fiber, fixed wireless, and postpaid phone services.
- Substantial Asset Impairments Impacting Profitability: The company incurred significant asset impairments, abandonments, and restructuring charges amounting to $3.37 billion. This charge materially impacted operating income, which decreased to $4.1 billion from $6.1 billion in the prior year quarter.
- Net Income Pressured by Non-Operating Expenses: Despite an operating income of $4.09 billion, net income attributable to AT&T was lower at $891 million, primarily due to a substantial negative total other income (expense) of $1.4 billion and interest expense of $1.98 billion.
- High Income Tax Expense on Continuing Operations: The company recorded a considerable income tax expense on continuing operations of $1.39 billion, which notably impacted the reported income from continuing operations.
- Service Revenue Dominance and Raised EPS Outlook: Service revenues remained the predominant revenue stream, totaling $26.3 billion, underpinning the company's core performance. Furthermore, AT&T raised its full-year adjusted EPS guidance to approximately $2.40.
Overall Takeaway
The Q3 2026 earnings call for AT&T was **neutral to slightly positive**. While the company demonstrated strong top-line growth, particularly in its Advanced Connectivity segment with robust customer additions and increased service revenue, significant asset impairments and substantial non-operating expenses, including high interest payments, heavily impacted net income. The raised adjusted EPS guidance indicates management's confidence in future profitability despite these challenges. Investors will likely focus on the continued growth in core connectivity services, balanced against the ongoing impact of these charges and the company's efforts to manage debt.
|
|
Revenue
$32.3B
|
|
Net Income
$855M
|
|
Net Margin
2.65%
|
|
🔍 Deep Dive: CSX CORP
Period Ending 2026-09-30
|
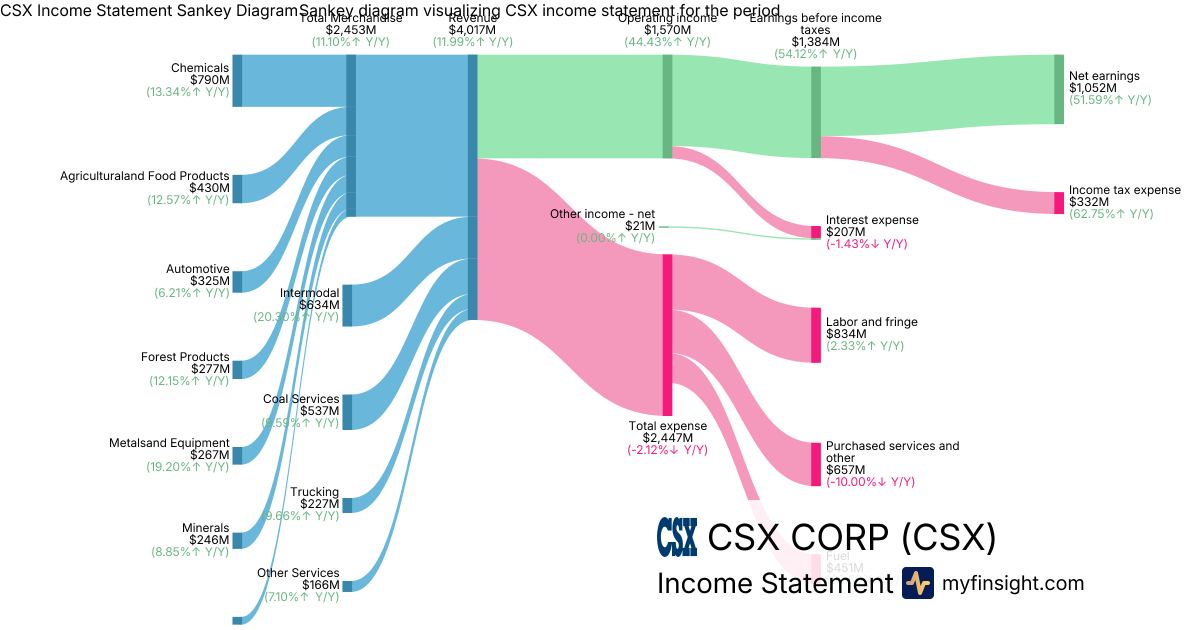
- Strong Financial Performance: CSX reported record quarterly revenue of $4.02 billion, marking a 12% increase year-over-year. Net earnings rose to $1.05 billion, an increase of 29% compared to adjusted results from the prior year, with diluted earnings per share (EPS) reaching $0.57, up 30%.
- Significant Operating Margin Expansion: Operating income grew 25% to $1.57 billion, against adjusted prior-year results. The operating margin expanded by 420 basis points to 39.1%, reflecting strong productivity gains and cost discipline despite increased fuel costs of $451 million.
- Volume Growth Driven by Intermodal and Merchandise: Total volume increased 5% year-over-year, primarily driven by robust performance in intermodal and merchandise segments. Intermodal volume specifically saw a 7% rise, contributing significantly to overall volume growth and achieving record revenue.
- Key Revenue Drivers and Segment Contributions: Revenue growth was broad-based, with strong contributions from merchandise, intermodal, and coal sectors. The Rail Segment generated $3.79 billion, while Total Merchandise revenue was $2.45 billion, with notable strength in chemicals and metals demand. Coal Services revenue reached $537 million and Intermodal contributed $634 million.
- Positive Guidance and Identified Risks: CSX raised its full-year 2026 revenue growth outlook to the high-single-digit percentage range. Management maintained guidance for full-year operating-margin expansion, capital expenditures, and free cash flow growth, while acknowledging near-term risks such as fuel price volatility and supply constraints in the fertilizer market, which experienced a 13% decline in volume.
Overall Takeaway
The Q3 2026 earnings call for CSX was broadly positive. The company demonstrated robust financial performance with record revenue and strong net earnings growth, driven by effective operational execution and disciplined cost management, which led to significant operating margin expansion. Despite facing higher fuel costs and some segment-specific headwinds like fertilizer, positive volume trends, particularly in intermodal and merchandise, and an optimistic raised revenue outlook for the full year suggest continued momentum.
|
|
Revenue
$4.02B
|
|
Net Income
$1.05B
|
|
Net Margin
26.19%
|
|
🔍 Deep Dive: United Airlines Holdings, Inc.
Period Ending 2026-09-30
|
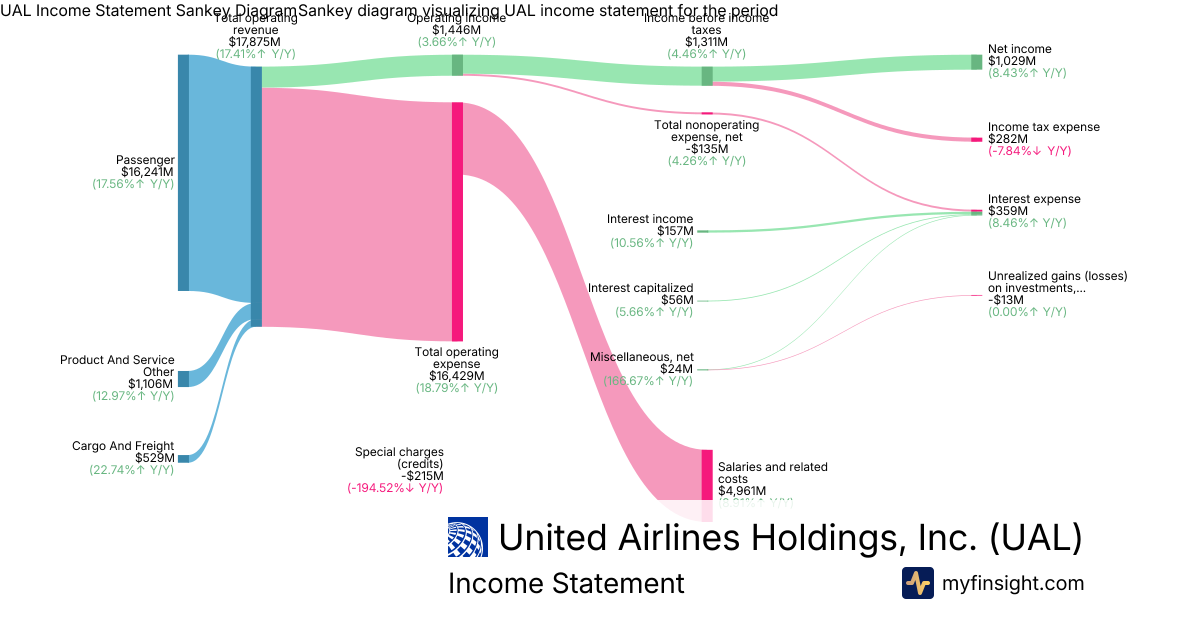
- Record Revenue Growth and Strong Demand: United Airlines reported record total operating revenue of $17.9 billion for Q3 2026, representing a 17% year-over-year increase. This growth was fueled by robust demand across all revenue streams, including 17% growth in premium and loyalty revenue, and a 26% increase in contracted business revenue.
- Profitability Maintained Amid Fuel Headwinds: The company posted adjusted diluted earnings per share of $2.54, which was within its guidance range despite a substantial $1.8 billion year-over-year increase in fuel expenses. Management emphasized its pricing discipline, stating that 72% of the increased fuel costs were recaptured during the quarter.
- Strategic Investments Driving Future Growth and Loyalty: United is actively investing in customer experience enhancements, notably the ongoing rollout of Starlink Wi-Fi on over 640 aircraft, which is observed to be driving customer share shifts from competitors and deepening brand loyalty. Future initiatives include the introduction of "Relax Row" and the continued addition of premium capacity through new aircraft like the A321neo Coastliner and A321XLR.
- Q4 Guidance Influenced by Fuel Cost Assumptions: The company provided Q4 2026 adjusted diluted earnings guidance of $0.50 to $1.50 per share. This outlook is notably impacted by United's assumption of a higher average fuel price (approximately $4.80 per gallon) compared to analyst consensus estimates, underscoring fuel price volatility as a material factor for future earnings.
- Strengthened Financial Flexibility: United expanded its revolving credit facility from $3 billion to $5 billion, extending its maturity to 2031. This move, coupled with plans to pay down gross debt by a matching amount, aims to generate annual interest savings.
Overall Takeaway
The Q3 2026 earnings call for United Airlines was broadly positive. The company delivered record revenue growth, demonstrating strong demand and effective pricing strategies that allowed it to maintain profitability despite significant increases in fuel costs. Ongoing strategic investments and initiatives are positioned to enhance customer loyalty and drive future performance, although the Q4 guidance indicates that managing volatile fuel prices will remain a key focus.
|
|
Revenue
$17.9B
|
|
Net Income
$1.03B
|
|
Net Margin
5.76%
|
|
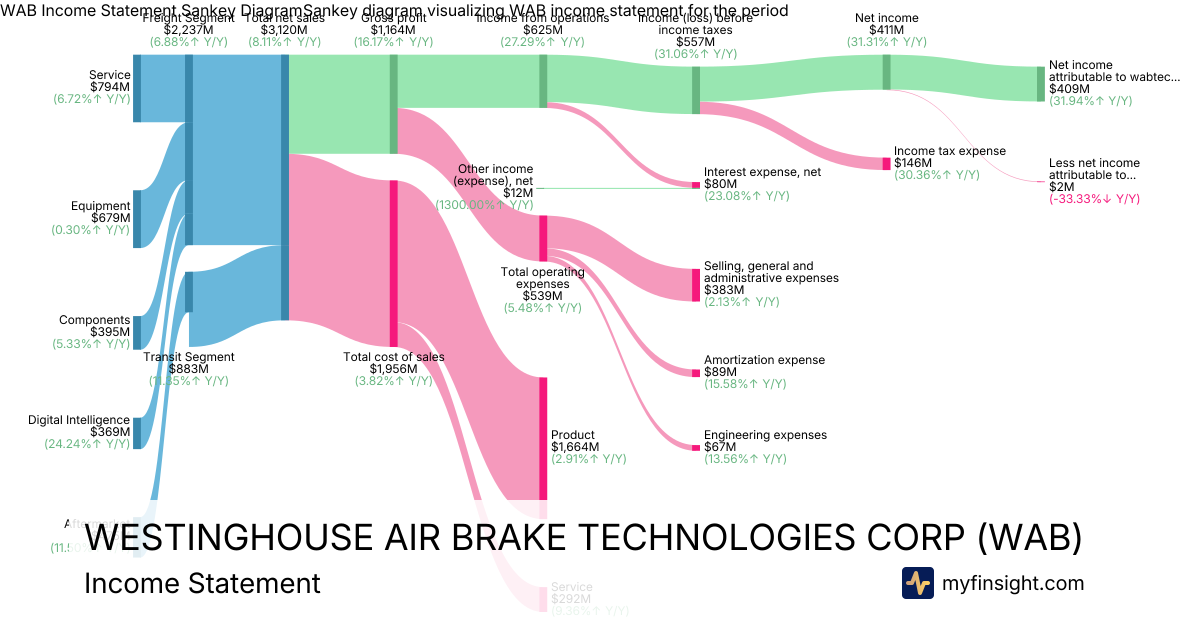
🔍 Deep Dive: WESTINGHOUSE AIR BRAKE TECHNOLOGIES CORP
Period Ending 2026-09-30
|
- Revenue Performance and Analyst Expectations: Wabtec reported Q3 2026 total net sales of $3.12 billion, an 8.1% year-over-year increase. While sales growth was solid, it slightly missed analyst estimates of $3.20 billion. The company noted some revenue timing shifts as a contributing factor.
- Strong Earnings Beat and Margin Expansion: Despite the revenue miss, adjusted earnings per share (EPS) of $2.83 significantly beat analyst estimates of $2.73, representing a 22% increase year-over-year. This strong performance was primarily attributed to substantial margin expansion, with GAAP operating margin reaching 20.0% and adjusted operating margin increasing by 1.9 percentage points to 22.9%.
- Raised EPS Guidance and Reaffirmed Revenue Outlook: Management raised its full-year 2026 adjusted EPS guidance to a range of $10.85 to $11.05, reflecting an expected growth of 21.0% to 23.2% compared to 2025. Full-year revenue guidance was reconfirmed within the range of $12.30 billion to $12.60 billion.
- Robust Backlog Driving Future Growth: The company highlighted a significant multi-year backlog exceeding $31 billion, a 22.9% increase year-over-year. This strong order coverage indicates healthy future demand, especially for long-lead-time products like new locomotives and service agreements.
- Segment Performance and Operational Efficiency: The Freight Segment continued its strong performance, with sales increasing 6.9% to $2.24 billion and its adjusted operating margin expanding 190 basis points to 26.4%. The Transit Segment also saw robust growth, with revenues advancing 11.3% to $883 million, and its adjusted operating margin improving by 2.6 percentage points to 18.1%. Operational improvements, favorable product mix, and the Integration 3.0 program were key drivers for margin expansion across both segments.
Overall Takeaway
The Q3 2026 earnings call for Wabtec was broadly positive. Despite a slight miss on revenue expectations, the company delivered a significant beat on adjusted EPS, largely driven by strong margin expansion and operational efficiencies. The raised full-year EPS guidance and an expanding multi-year backlog provide a confident outlook for sustained future performance, underscoring the company's ability to translate demand into profitable growth.
|
|
Revenue
$3.12B
|
|
Net Income
$409M
|
|
Net Margin
13.11%
|
|
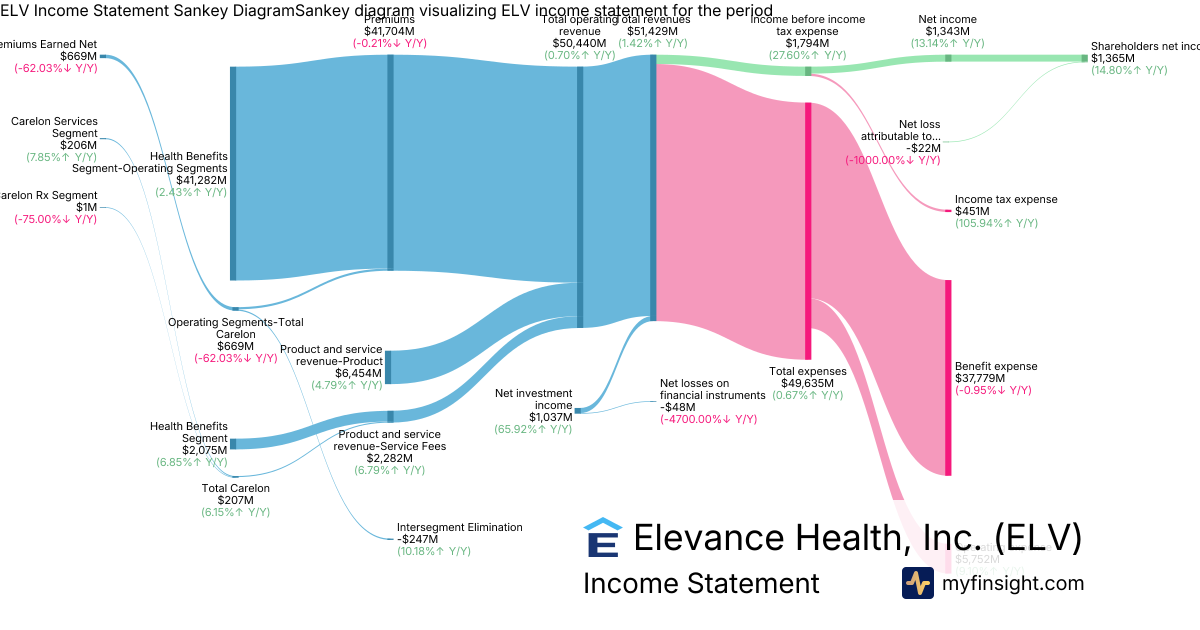
🔍 Deep Dive: Elevance Health, Inc.
Period Ending 2026-09-30
|
- Strong Earnings Beat and Raised Guidance: Elevance Health reported adjusted diluted EPS of $6.99 in Q3 2026, significantly exceeding analyst expectations. The company subsequently raised its 2026 adjusted diluted EPS guidance to at least $29.00 and maintained confidence in delivering at least 12% adjusted diluted EPS growth for 2027. Total operating revenue for the quarter reached $50.4 billion.
- Mixed Drivers for Earnings Outperformance: The robust earnings beat was comprised of approximately $0.50 per share from operational outperformance across its Medicaid, Medicare Advantage, and Individual ACA businesses, coupled with a larger $1.85 per share from favorable non-operating items, primarily investment income valuation adjustments. This composition contributed to a tempered market reaction despite the strong headline numbers.
- Improved Medical Cost Management and Strategic Investments: The benefit expense ratio improved by 70 basis points year-over-year to 90.6%, reflecting better medical cost management. However, the adjusted operating expense ratio increased 90 basis points to 11.3%, driven by targeted one-time investments aimed at future growth.
- Segment Strengths and Membership Dynamics: Both the Medicaid and Medicare Advantage segments performed ahead of expectations, contributing positively to the quarter's results. The Carelon segment also delivered a strong quarter and is anticipated to increase its contribution to overall enterprise earnings. Despite this, overall medical membership experienced a 1.1% decline to approximately 44.9 million members, primarily due to anticipated Medicaid attrition, partially offset by commercial fee-based growth.
- Strong Cash Flow Generation and Cost Savings: Elevance Health generated $1.3 billion in operating cash flow for the quarter, leading to a raised full-year operating cash flow guidance of at least $6.5 billion. The company's Elevate platform also identified more than $300 million in anticipated cost savings for the current year. Cash and cash equivalents stood at $10.3 billion as of September 30, 2026.
Overall Takeaway
The Q3 2026 earnings call for Elevance Health was **neutral to cautiously positive**. While the company surpassed adjusted EPS expectations and raised its full-year guidance, the market reaction was muted due to a significant portion of the earnings beat stemming from non-operating gains rather than purely operational outperformance. Despite solid underlying performance in key segments and effective medical cost management, investor scrutiny over the quality of earnings might lead to a more conservative short-term outlook, even with promising 2027 growth projections.
|
|
Revenue
$51.4B
|
|
Net Income
$1.36B
|
|
Net Margin
2.65%
|
|
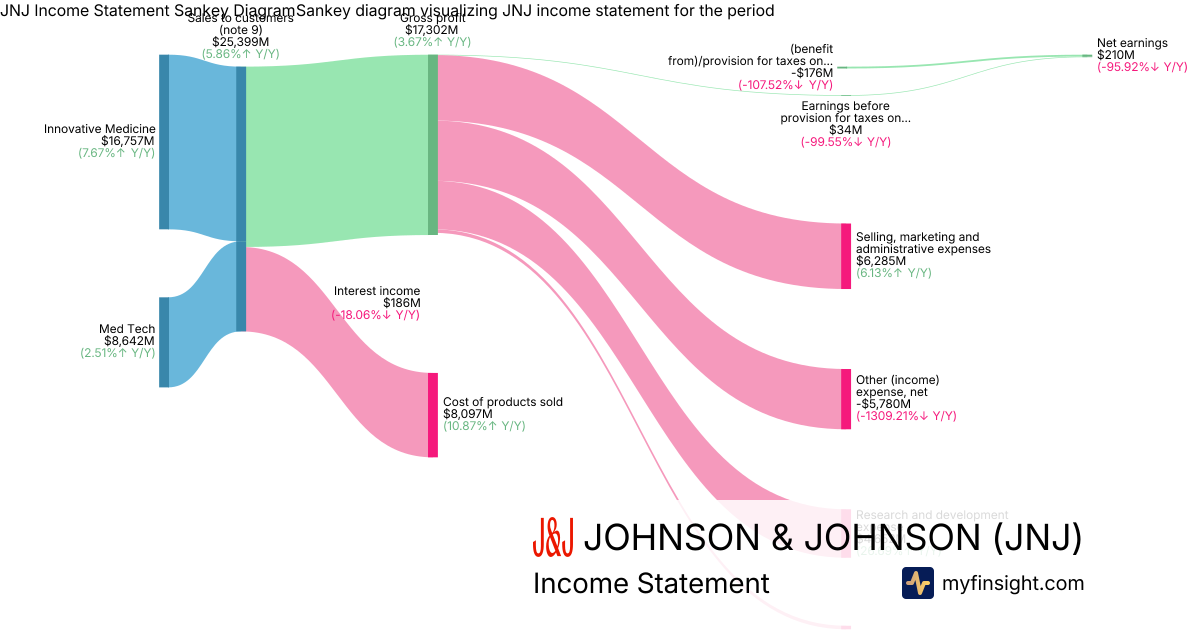
🔍 Deep Dive: JOHNSON & JOHNSON
Period Ending 2026-09-27
|
- Robust Top-Line Performance Driven by Key Segments: Johnson & Johnson reported strong total sales of $25.4 billion. This growth was significantly propelled by its Innovative Medicine segment, contributing $16.8 billion, and the Med Tech segment, which generated $8.64 billion.
- Significant Non-Operating Charges Impacting Profitability: Net earnings were substantially impacted, reporting at $210 million. This was largely due to a considerable $5.78 billion recorded as 'Other (income) expense, net,' alongside $181 million in restructuring charges and $339 million in in-process research and development impairments.
- Sustained High Investment in Research and Development: The company maintained a strong commitment to future growth drivers with total research and development expenses reaching $4.65 billion. The Innovative Medicine segment accounted for a significant portion of this, with $3.89 billion, underscoring its importance for long-term pipeline development.
- Solid Liquidity Position and Manageable Debt: Johnson & Johnson demonstrated financial strength with $16.9 billion in cash and cash equivalents, providing ample liquidity. The company's long-term debt stood at $35.8 billion.
- Strategic Realignment Through Significant Charges: The substantial 'Other (income) expense, net' and restructuring charges suggest ongoing strategic adjustments, potentially involving portfolio rationalization or asset impairments, which could impact short-term earnings but are aimed at optimizing long-term performance and focus on core growth areas.
Overall Takeaway
The earnings call for Johnson & Johnson was broadly neutral to slightly negative. While the company delivered robust top-line revenue growth driven by its key segments and maintained significant investment in R&D for future innovation, profitability was severely compressed by substantial non-operating charges and restructuring costs. Investors will likely be focused on understanding the nature and future recurrence of these significant expenses, which overshadowed an otherwise solid operational performance and may signal ongoing strategic shifts.
|
|
Revenue
$25.4B
|
|
Net Income
$210M
|
|
Net Margin
0.83%
|
|
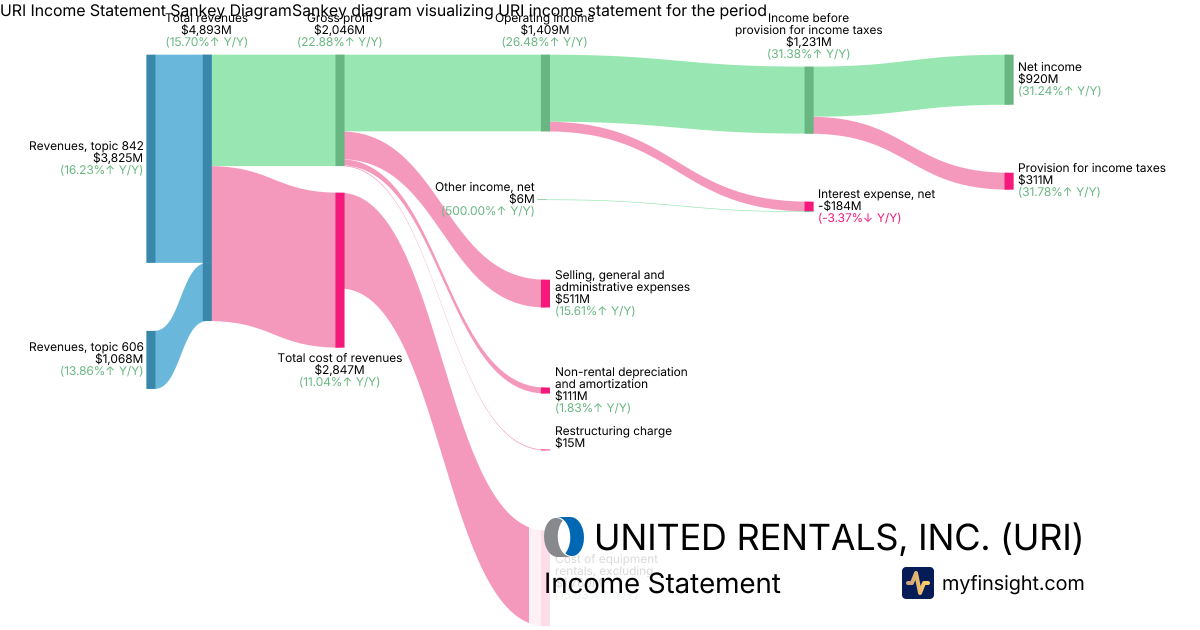
🔍 Deep Dive: UNITED RENTALS, INC.
Period Ending 2026-09-30
|
- Exceptional Q3 Financial Performance: United Rentals reported $4.893 billion in total revenue, a 15.7% increase year-over-year, significantly exceeding analyst estimates. This strong top-line growth was accompanied by a 35.4% surge in GAAP diluted EPS to $14.77 and adjusted EPS of $15.55, also beating expectations. Net income for the quarter was $920 million.
- Elevated Full-Year Guidance: Reflecting confidence, management raised its full-year revenue guidance to $18.1 billion at the midpoint and adjusted EBITDA guidance to $8.35 billion, surpassing prior outlooks and analyst consensus.
- Specialty Rentals Driving Growth & Margin Expansion: The Specialty Rentals segment was a significant growth driver, with revenue jumping 34.7% to $1.70 billion. This, combined with operational efficiencies, led to a 160 basis point expansion in adjusted EBITDA margin to 47.6%, with adjusted EBITDA reaching $2.331 billion.
- Operational Efficiencies and Fleet Productivity: Profitability was further bolstered by operational efficiencies in depreciation, labor, and maintenance, alongside a 6.5% year-over-year increase in fleet productivity.
- Capital Allocation and Shareholder Returns: The company initiated a new share repurchase program, demonstrating a continued commitment to returning capital to shareholders, following the completion of a prior program.
Overall Takeaway
The Q3 2026 earnings call for United Rentals was broadly positive. The company delivered record financial results, significantly exceeding market expectations on both revenue and earnings. The raised full-year guidance, robust growth in the Specialty Rentals segment, and strong operational efficiencies underscore a solid operational environment and effective management strategy.
|
|
Revenue
$4.89B
|
|
Net Income
$920M
|
|
Net Margin
18.80%
|
|
🔍 Deep Dive: INTUITIVE SURGICAL INC
Period Ending 2026-09-30
|
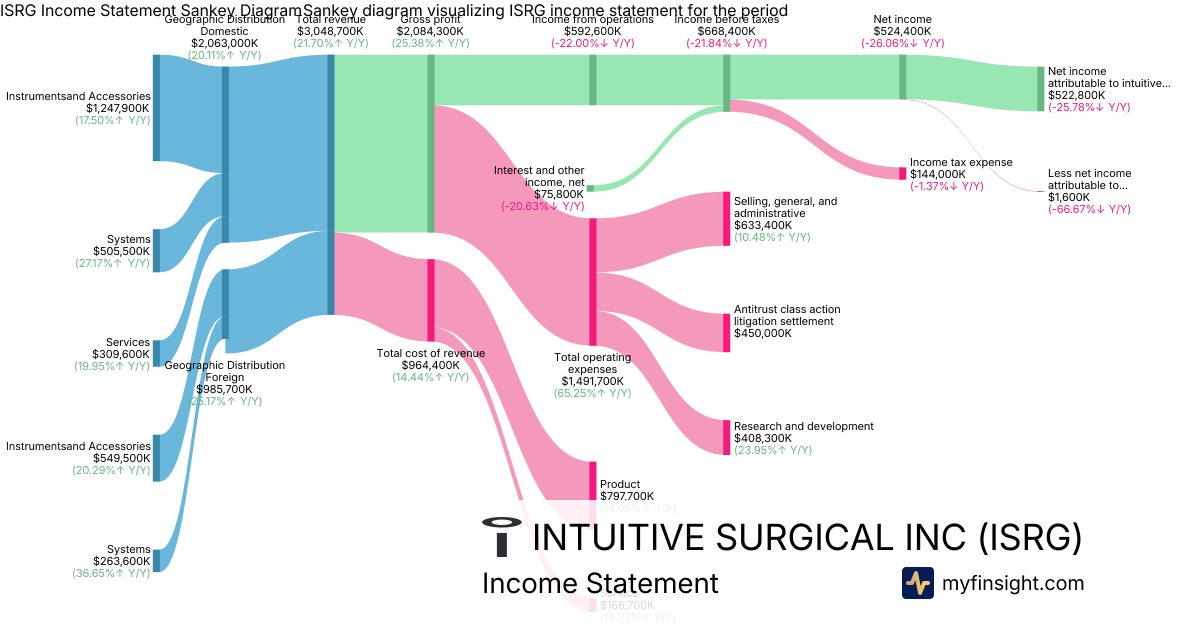
- Strong Revenue Growth Driven by Procedures and Recurring Revenue: Intuitive Surgical reported robust $3.05 billion in total revenue for Q3 2026, a 22% increase year-over-year, with 84% of quarterly revenue being recurring. This growth was supported by a 15% increase in combined da Vinci and Ion procedures and strong performance in Instruments and Accessories revenue of $1.8 billion.
- Significant Litigation Settlement Impacted GAAP Profitability: GAAP net income was materially affected by a $450 million pre-tax charge related to an antitrust class action litigation settlement, resulting in GAAP net income of $523 million. However, non-GAAP EPS rose 25% to $3.00, beating analyst estimates.
- Increased System Placements and Expanding Installed Base: The company placed 546 da Vinci systems, a 28% increase, including 315 da Vinci 5 systems, and 56 Ion systems, growing its global installed base to over 13,200 systems. This indicates continued adoption and market penetration of its robotic platforms.
- Strategic Pricing Actions and Narrowed Guidance: Management announced upcoming pricing actions expected to reduce da Vinci I&A revenue per procedure by 3%-5% to drive adoption, and narrowed its FY2026 da Vinci procedure growth guidance to 14%-15%. This suggests a focus on long-term market expansion while acknowledging near-term revenue per procedure impacts.
- Strong International Procedure Growth and R&D Investment: da Vinci procedure growth outside the US was particularly strong at 20%, significantly outpacing domestic growth of 10%. The company continues to invest in R&D, AI capabilities, and new system features to support innovation and international expansion.
Overall Takeaway
The Q3 2026 earnings call for Intuitive Surgical was broadly positive. Despite a significant one-time litigation settlement that impacted GAAP profitability, the company demonstrated strong underlying operational performance with robust revenue growth, increasing procedure volumes across both da Vinci and Ion platforms, and continued expansion of its installed base globally. The strategic pricing adjustments and R&D investments highlight a forward-looking approach to drive broader adoption and sustain long-term growth, particularly in international markets.
|
|
Revenue
$3.05B
|
|
Net Income
$523M
|
|
Net Margin
17.15%
|
|
This newsletter is sent from
MyFinsight.com.
Was this email forwarded to you? Sign up here.
Unsubscribe
Copyright © 2026 MyFinsight, All rights reserved.
|