🔗 SPACE EXPLORATION TECHNOLOGIES CORP, 🚨 American Airlines Group Inc., 🔗 PG&E Corp, 🚨 COMCAST CORP, 🔗 Tesla, Inc.

|

|
|
Daily Summary
|
October 22, 2026
|
Welcome to your daily digest. Today we are analyzing the latest income statements and filings from:
|
|
|
|
🔍 Deep Dive: SPACE EXPLORATION TECHNOLOGIES CORP
Period Ending 2026-09-30
|
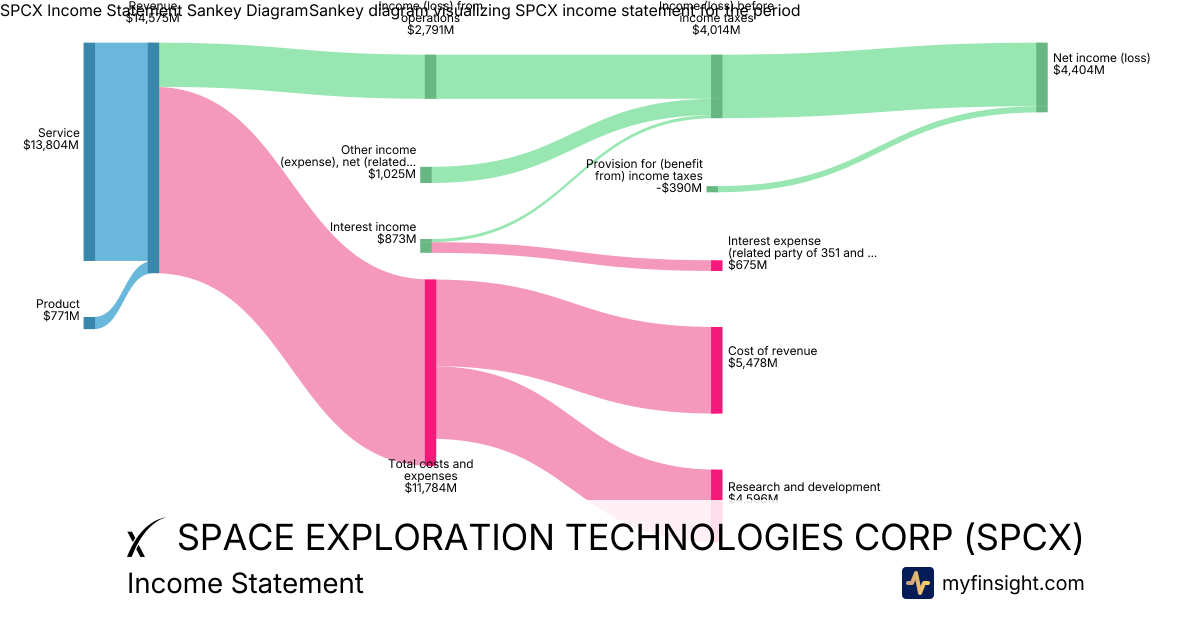
- Robust Top-Line Performance: SPCX reported total revenue of $14.6 billion, with service revenue comprising the vast majority at $13.8 billion, indicating strong demand for its offerings.
- Diversified Revenue Streams with SI Leading: The Solutions and Infrastructure (SI) segment was the primary revenue driver, contributing $7.56 billion. Connectivity and Space segments also showed significant contributions of $5.25 billion and $1.77 billion, respectively, highlighting a broad base of growth.
- Strong Profitability Amidst High R&D Investment: Despite substantial investment in research and development amounting to $4.6 billion, SPCX achieved a net income of $4.4 billion, demonstrating efficient management of innovation costs while maintaining healthy bottom-line results.
- Significant Contribution from Other Income Sources: Non-operating income streams, specifically other income (expense), net, of $1.02 billion, and interest income of $873 million, materially boosted overall profitability, suggesting effective capital management or strong non-core assets.
- Solid Operational Income: The company reported an income from operations of $2.79 billion, indicating the core business is generating substantial profits before considering non-operating items and taxes.
Overall Takeaway
The earnings call was broadly positive. SPCX demonstrated strong revenue growth across its key segments, particularly in Solutions and Infrastructure, while maintaining robust profitability despite significant investments in research and development. The substantial contributions from other income streams further bolstered the net income, reflecting a healthy financial position and effective capital deployment.
|
|
Revenue
$14.6B
|
|
Net Income
$4.4B
|
|
Net Margin
30.22%
|
|
🔍 Deep Dive: American Airlines Group Inc.
Period Ending 2026-09-30
|
|
🚨 Price Alert: The stock price jumped by 6.87% around the earning call.
|
American Airlines (AAL) has experienced significant stock price fluctuations around its recent Q3 2026 earnings call, primarily driven by a dichotomy between record revenue growth and a substantial net loss fueled by soaring operating costs. Despite strong demand for air travel, particularly in premium segments, the airline's profitability was severely impacted by an unprecedented surge in fuel expenses and its existing high debt load. This complex financial picture, coupled with a cautious outlook for the near future, has contributed to investor uncertainty and subsequent market volatility.
Key Factors Contributing to Volatility:
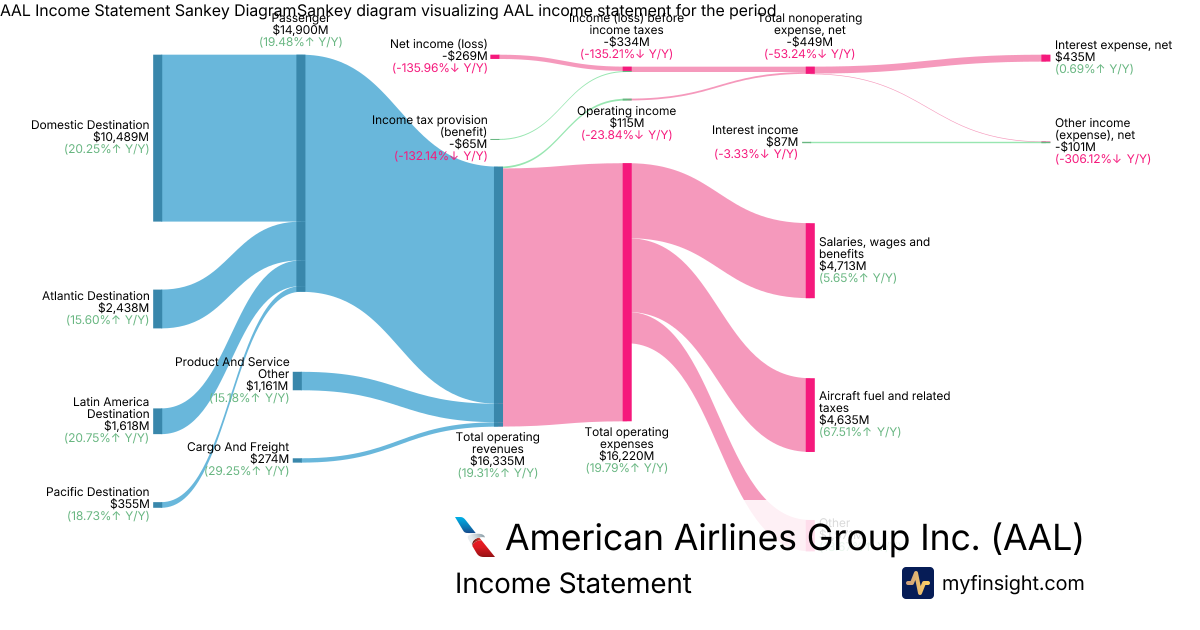
- Record Revenue Growth Amid Strong Demand: American Airlines reported record total operating revenues of $16.3 billion in Q3 2026, marking a 19.3% year-over-year increase and surpassing its guidance. This growth was propelled by robust demand across all cabins and geographies, especially in premium and corporate travel segments.
- Significant Net Loss Due to Soaring Fuel Costs: Despite strong top-line performance, the company recorded a GAAP net loss of -$269 million for the quarter. This loss was predominantly driven by a substantial 67.5% year-over-year surge in aircraft fuel and related taxes, which reached $4.63 billion.
- Cautious Outlook and Capacity Adjustments: American provided a cautious outlook, projecting continued adjusted losses for Q4 2026 and the full year 2026, largely due to persistently high fuel prices. Consequently, the airline plans to decelerate capacity growth in 2027 to better manage profitability.
- High Debt Load and Negative Equity: The company continues to navigate a challenging financial structure, evidenced by negative stockholders' equity of -$4.22 billion and a significant net debt position, which is expected to be approximately $30.5 billion by year-end 2026. This financial leverage underscores its vulnerability to ongoing cost pressures and interest rate fluctuations.
|
|
Revenue
$16.3B
|
|
Net Income
-$269M
|
|
Net Margin
-1.65%
|
|
🔍 Deep Dive: PG&E Corp
Period Ending 2026-09-30
|
- Mixed Earnings and Reaffirmed Guidance: PG&E Corporation reported Q3 2026 core earnings per share of $0.41, missing the $0.42 consensus estimate, and GAAP earnings per share of $0.34 for the quarter. Despite the quarterly miss, the company reaffirmed its full-year 2026 core EPS guidance of $1.64 to $1.66, representing 10% growth at the midpoint from 2025, and 2027 core EPS guidance of $1.78 to $1.82, or 9% growth at the midpoint from 2026.
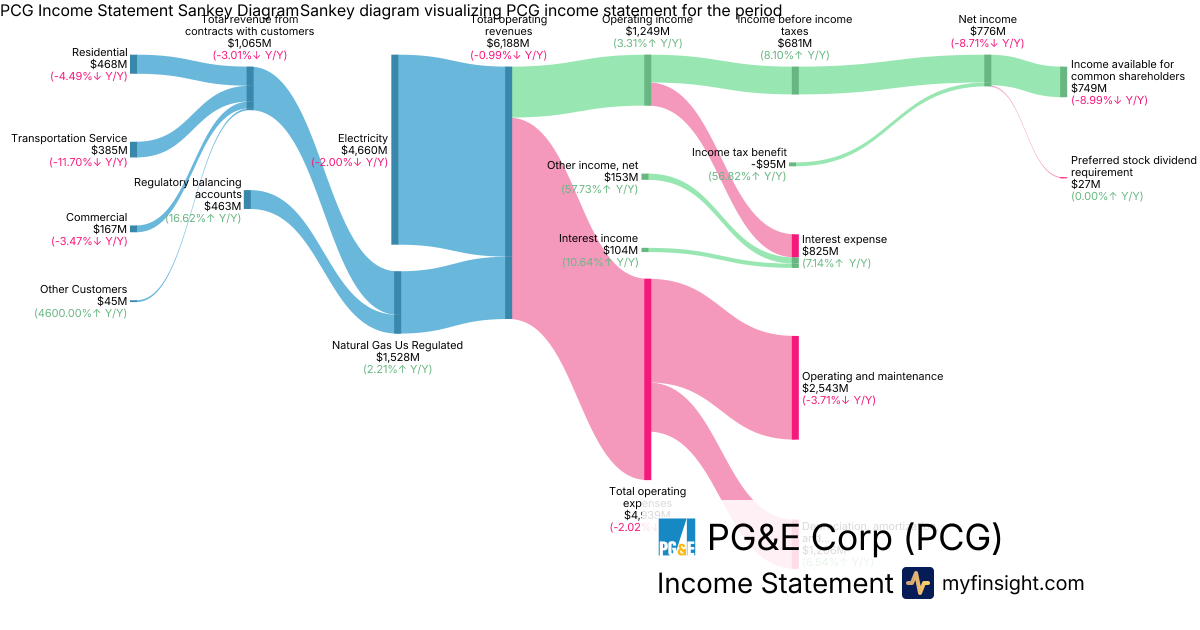
- Revenue Decline and Operational Cost Management: Total operating revenues for Q3 2026 were $6.19 billion, down 1% year-over-year. However, the company demonstrated operational efficiency, with total operating expenses decreasing by 2% year-over-year to $4.94 billion. Management remains on track to achieve its target of 2% to 4% annual non-fuel operating and maintenance (O&M) cost reductions.
- Capital Plan Reduction and Strategic Review: PG&E reduced its 2027 capital plan by $2 billion to $11.4 billion due to high financing costs and its sub-investment grade credit status. The company is actively pursuing a strategic review to enhance its credit profile and address wildfire liability, exploring options such as corporate ring-fencing, asset sales, and business separations. Equity financing needs are reportedly covered through 2030 under the alternatives being considered.
- Advancements in Wildfire Safety: PG&E highlighted its safety transformation, marking the fourth consecutive year without a major wildfire attributed to its equipment. The company filed a 10-year Electric Undergrounding Plan, proposing 5,000 additional miles of undergrounding from 2028 through 2037, with a projected $16.6 billion investment. This initiative is expected to yield approximately $117 billion in long-term customer benefits and avoid $6 billion in future O&M costs.
- Growth Drivers and Financial Health Concerns: Customer capital investment continues to be a primary driver of earnings growth. The company is also seeing an expanding data center pipeline, with 174 MW energized since 2024 and 1.8 GW expected online by 2030. However, ongoing wildfire liability concerns led Fitch to revise its outlook on PG&E to negative, while S&P noted heightened risks for California investor-owned utilities. Total assets stand at $147 billion, with long-term debt at $61.3 billion.
Overall Takeaway
The Q3 2026 earnings call for PCG was broadly neutral to slightly negative. While the reaffirmation of 2026 and 2027 core EPS guidance and continued progress in wildfire safety and O&M efficiency were positive, the quarter saw a miss on core EPS and revenue estimates. Investor concerns persist due to the reduction in the 2027 capital plan stemming from high financing costs and the ongoing uncertainty surrounding wildfire liability, which continues to impact the company's credit quality and strategic flexibility.
|
|
Revenue
$6.19B
|
|
Net Income
$749M
|
|
Net Margin
12.10%
|
|
🔍 Deep Dive: COMCAST CORP
Period Ending 2026-09-30
|
|
🚨 Price Alert: The stock price jumped by 8.50% around the earning call.
|
Comcast (CMCSA) has recently experienced significant price volatility around its earnings call, primarily driven by investor reactions to the performance of its diverse operational segments, particularly in residential connectivity, alongside its media, studios, and theme parks divisions. The market closely scrutinized overall revenue growth, segment-specific trends, and the company's profitability and cost management.
Key Factors Contributing to Volatility:
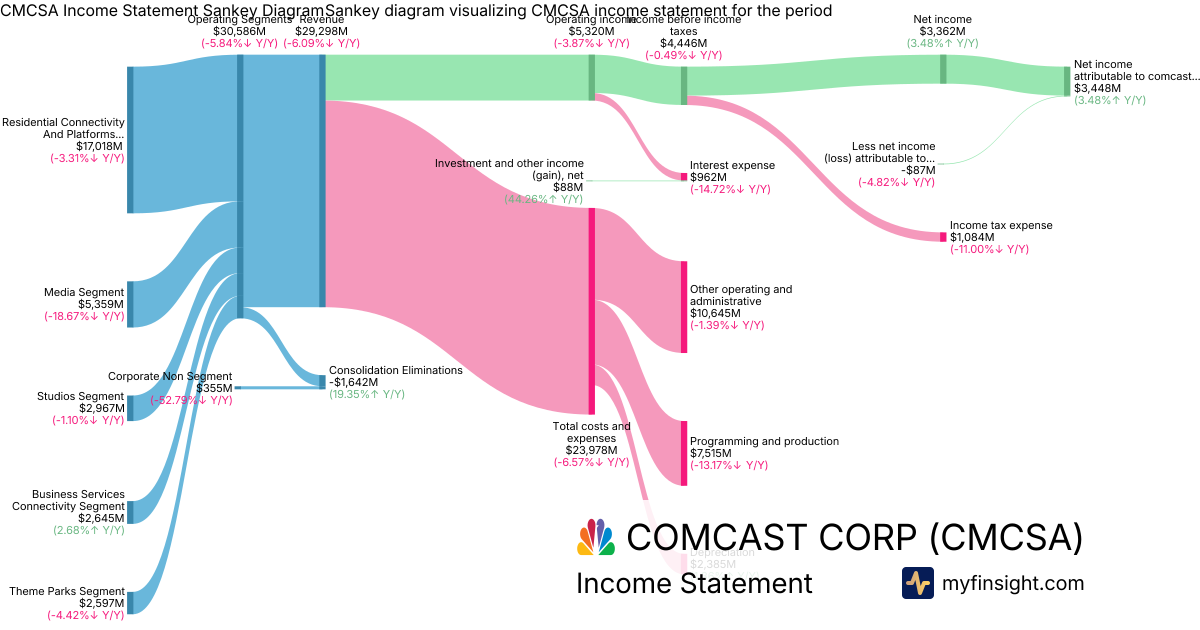
- Overall Revenue Performance: Comcast reported total revenues of $29.3 billion, with investor sentiment likely fluctuating based on whether this top-line figure met, exceeded, or fell short of market expectations.
- Residential Connectivity and Broadband Strength: The Residential Connectivity and Platforms segment generated $17 billion in revenue, with a notable contribution from Domestic Broadband revenues of $6.24 billion, making its performance a critical driver of stock movement.
- Media and Entertainment Segment Trends: The market also focused on the performance of its Media segment, contributing $5.36 billion, and Theme Parks, with $2.6 billion in revenue, as these areas are sensitive to advertising markets and consumer spending.
- Profitability Assessment: The reported Net income attributable to Comcast Corporation of $3.45 billion was a key figure, influencing investor confidence based on its comparison to analyst estimates and prior periods.
- Cost Management and Operational Efficiency: With total costs and expenses reaching $24 billion, including substantial programming and production costs of $7.51 billion, the effectiveness of the company's cost control measures likely played a role in market reactions.
|
|
Revenue
$29.3B
|
|
Net Income
$3.45B
|
|
Net Margin
11.77%
|
|
🔍 Deep Dive: Tesla, Inc.
Period Ending 2026-09-30
|
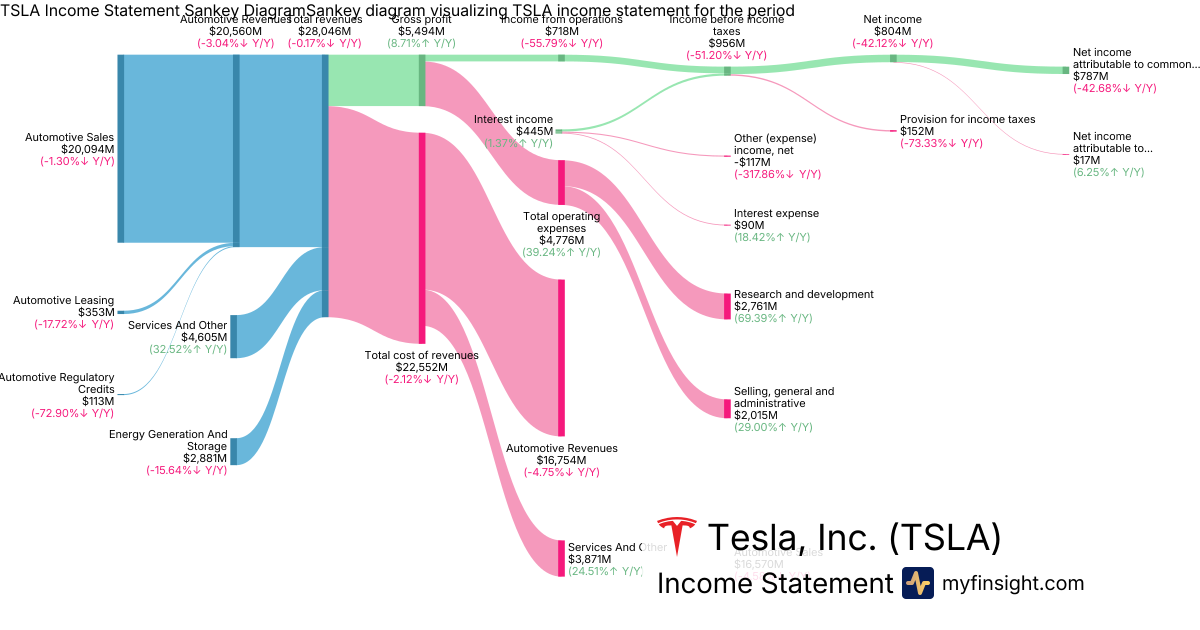
- Strong Financial Performance and Margin Expansion: Tesla reported Q3 2026 adjusted earnings of $0.48 per share and revenues of $28.05 billion, modestly exceeding analyst expectations. Automotive gross margin (excluding credits) improved to 18.1% from 16.3% in the prior quarter. The company also maintained positive free cash flow of over $1.5 billion and ended the quarter with substantial cash and cash equivalents of $17.9 billion and short-term investments of $27.6 billion.
- FSD as a Key Demand Driver and Robotaxi Progress: Full Self-Driving (FSD) was highlighted as a primary driver of demand, with an attach rate exceeding 75% for new North American deliveries and over 1.7 million paid FSD customers globally. Tesla launched Cybercab operations in Austin, with plans for customer-owned vehicles to join the Robotaxi network around Q2 2027 and a target of 24/7 service by year-end.
- Surging Energy Business Growth: The Energy Generation and Storage segment deployed 13.7 GWh of energy storage in Q3, marking its second-best quarter ever, with gross margins significantly improving to 33.1%. Megapack production is almost sold out for all of 2027, driven by strong demand, particularly from data centers.
- Strategic Investments and Revised Capital Expenditure: Tesla revised its 2026 capital expenditure guidance to approximately $20 billion (down from over $25 billion), citing efficient capital deployment. However, the company secured capacity to borrow up to $30 billion for future capex, with significant ongoing investments planned for Super Intelligence (AI compute), robotics (Optimus production ramping), and a semiconductor fabrication plant. Operating expenses, including research and development of $2.76 billion and selling, general and administrative expenses of $2.02 billion, are expected to continue rising due to these transformative projects.
- Ambitious Production Targets and New Product Development: Tesla aims to produce 5 million vehicles annually by approximately 2030, with factories currently operating at record rates. The company also commenced volume production of the Tesla Semi and unveiled the Next Gen Roadster, while making progress on 4680 cell production to support Cybercab and Semi ramps.
Overall Takeaway
The Q3 fiscal 2026 earnings call for Tesla was broadly positive. The company exceeded financial expectations with improved margins and strong cash flow, while demonstrating significant progress in its high-growth FSD and energy storage segments. Despite a revised, lower capital expenditure guidance for 2026, Tesla outlined ambitious long-term investment plans in AI, robotics, and autonomous transport, signaling a strong focus on future growth drivers beyond traditional vehicle manufacturing. The increasing operating expenses reflect these strategic investments, which are expected to yield substantial returns in the coming years.
|
|
Revenue
$28B
|
|
Net Income
$787M
|
|
Net Margin
2.81%
|
|
🔍 Deep Dive: Meta Platforms, Inc.
Period Ending 2026-09-30
|
|
🚨 Price Alert: The stock price dropped by 12.03% around the earning call.
|
Meta Platforms (META) has experienced significant price fluctuations around its recent Q3 2026 earnings call, driven by a combination of robust core advertising performance, substantial one-time legal charges, and heavy, yet promising, investments in artificial intelligence (AI) and the metaverse. Despite strong revenue growth, investor sentiment was tempered by increased capital expenditures and persistent losses in its Reality Labs division.
Key Factors Contributing to Volatility:
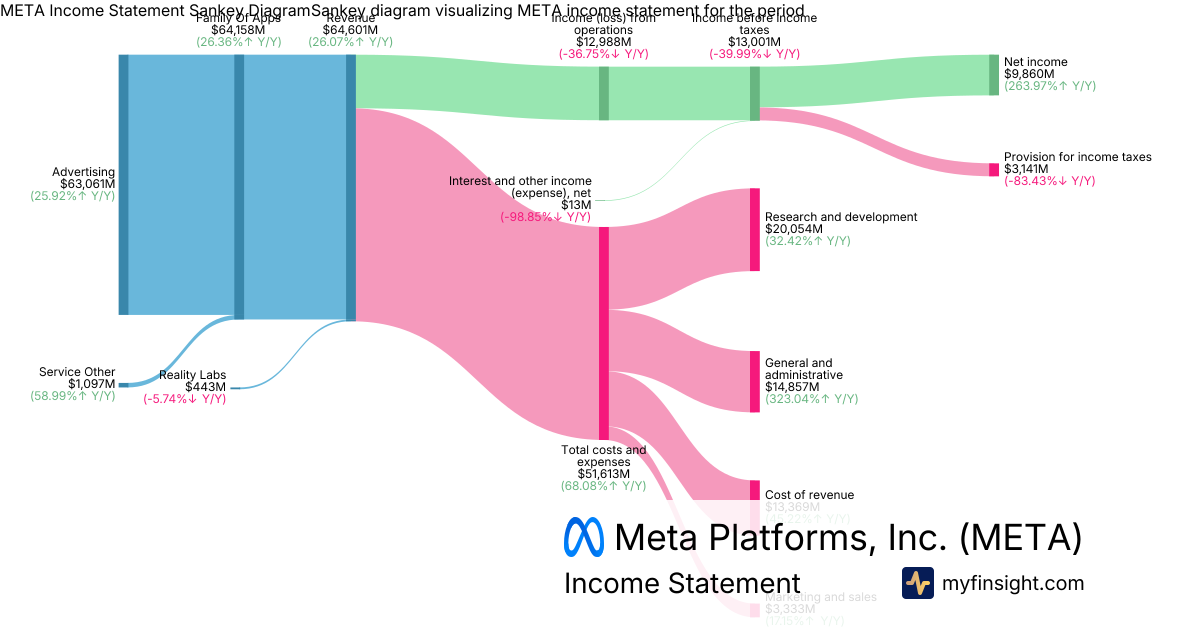
- Robust Advertising Revenue Growth: Meta reported strong Q3 2026 total revenue of $64.6 billion, a 26% year-over-year increase, significantly beating analyst expectations. This was primarily driven by its advertising business, which generated $63.1 billion in revenue. Growth was fueled by a 10% increase in ad impressions and a 14% rise in the average price per ad, largely attributed to AI-powered improvements in ad performance and better macroeconomic conditions.
- Significant Legal Settlement Charge: Reported earnings per share (EPS) missed analyst expectations due to a substantial one-time pre-tax charge of $9.89 billion recognized in Q3 total expenses. This charge was related to a litigation settlement concerning teen mental health and social media. Excluding this charge, Meta's operating income and EPS would have comfortably exceeded consensus estimates.
- Aggressive AI Investments & Capital Expenditures: Meta's commitment to developing advanced AI infrastructure led to significant capital expenditures of $34.91 billion for the quarter. These heavy investments resulted in negative free cash flow of -$2.12 billion. While these expenses pressured short-term profitability and cash flow, management emphasized that AI investments are already driving incremental advertising revenue and are crucial for future growth initiatives, including new AI products like Muse.
- Ongoing Reality Labs Losses: The Reality Labs division, Meta's metaverse-focused segment, continued to report substantial operating losses, with a narrowed loss of $4.13 billion for the quarter. Cumulatively, Reality Labs has amassed approximately $92 billion in operating losses since 2020. While Meta projects these losses to decline in 2027, the ongoing significant capital allocation to this segment without clear near-term returns remains a point of investor scrutiny.
- High Market Anticipation and Options Volatility: Leading up to the earnings release, options traders anticipated a considerable stock price movement, pricing in a potential fluctuation of ±7.0%. This elevated implied volatility, characteristic of earnings events, contributed to the sharp price swings observed as investors reacted to the mixed financial results and future outlook.
|
|
Revenue
$64.6B
|
|
Net Income
$9.86B
|
|
Net Margin
15.26%
|
|
🔍 Deep Dive: Bloom Energy Corp
Period Ending 2026-09-30
|
|
🚨 Price Alert: The stock price dropped by 9.01% around the earning call.
|
Bloom Energy (BE) has experienced significant price fluctuations around its recent earnings call, driven by a confluence of strong operational performance, growing demand for its core offerings, and specific investor concerns. The company reported impressive third-quarter 2026 financial results, exceeding analyst expectations, primarily fueled by the surging need for distributed power solutions in the artificial intelligence (AI) data center market. However, despite robust revenue growth and a turn to profitability, negative cash flow in the quarter contributed to the stock's volatility.
Key Factors Contributing to Volatility:
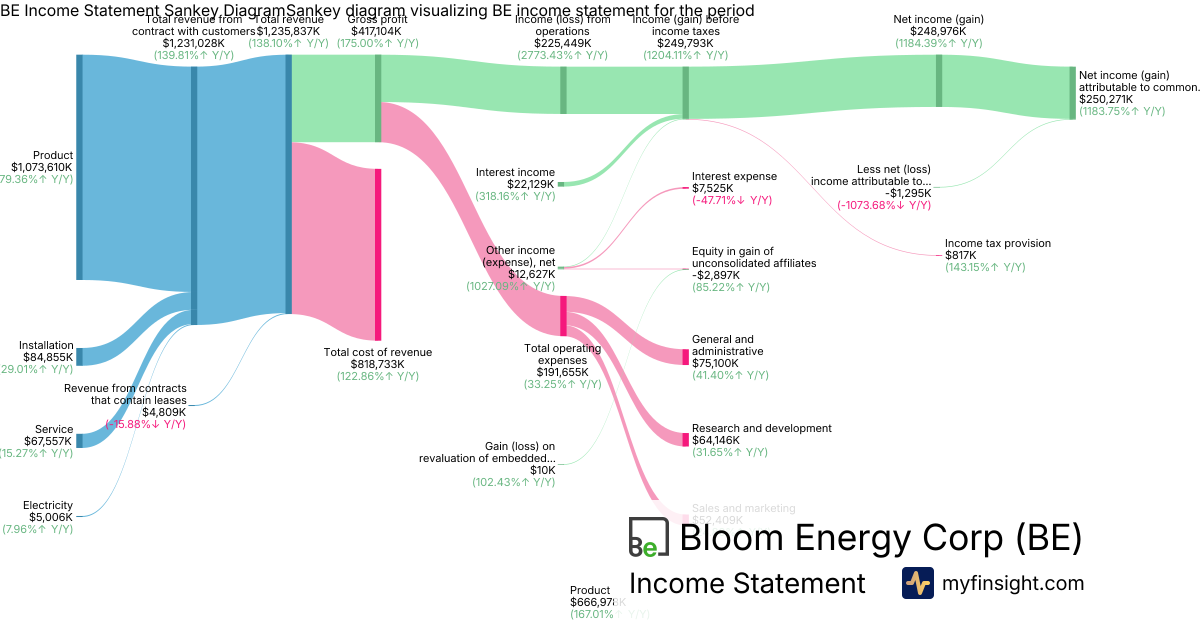
- Exceptional Q3 2026 Earnings Beat: Bloom Energy reported total revenue of $1.24 billion, a 138.1% year-over-year increase, significantly surpassing analyst estimates. The company also turned to net profitability with a net income (loss) of $249 million, compared to a loss in the prior year period.
- Surging Demand from AI Data Centers: Renewed enthusiasm for AI data-center power demand has been a significant driver, with Bloom Energy's on-site fuel cells positioned as a crucial solution to the escalating power and cooling constraints for AI deployment.
- Strong Product Revenue Growth and Margin Expansion: The product segment was a primary growth driver, generating revenue of $1.07 billion, up 179.4% year-over-year. This, combined with a GAAP gross profit of $417 million and improved gross margins, demonstrates robust operational efficiency.
- Negative Cash Flow Dampening Sentiment: Despite strong earnings, the company reported a negative net cash flow of approximately $180 million for the quarter, which "spooked investors" and led to a stock price decline in after-hours trading.
- Raised Full-Year Guidance: Bloom Energy raised its full-year 2026 revenue guidance to a range of $4.4 billion to $4.6 billion and its EPS guidance to $3.10 to $3.40, indicating management's confidence in continued growth and strong market positioning.
|
|
Revenue
$1.24B
|
|
Net Income
$250M
|
|
Net Margin
20.25%
|
|
🔍 Deep Dive: LAM RESEARCH CORP
Period Ending 2026-09-27
|
|
🚨 Price Alert: The stock price dropped by 19.79% around the earning call.
|
Lam Research (LRCX) has experienced significant price fluctuations around its recent Q1 2027 (fiscal quarter ending September 27, 2026) earnings call, driven by a combination of exceptionally strong current financial performance and a cautious outlook for the subsequent quarter. While the company reported record revenue and profitability, investor reaction was notably negative due to a revenue forecast that fell short of elevated market expectations.
Key Factors Contributing to Volatility:
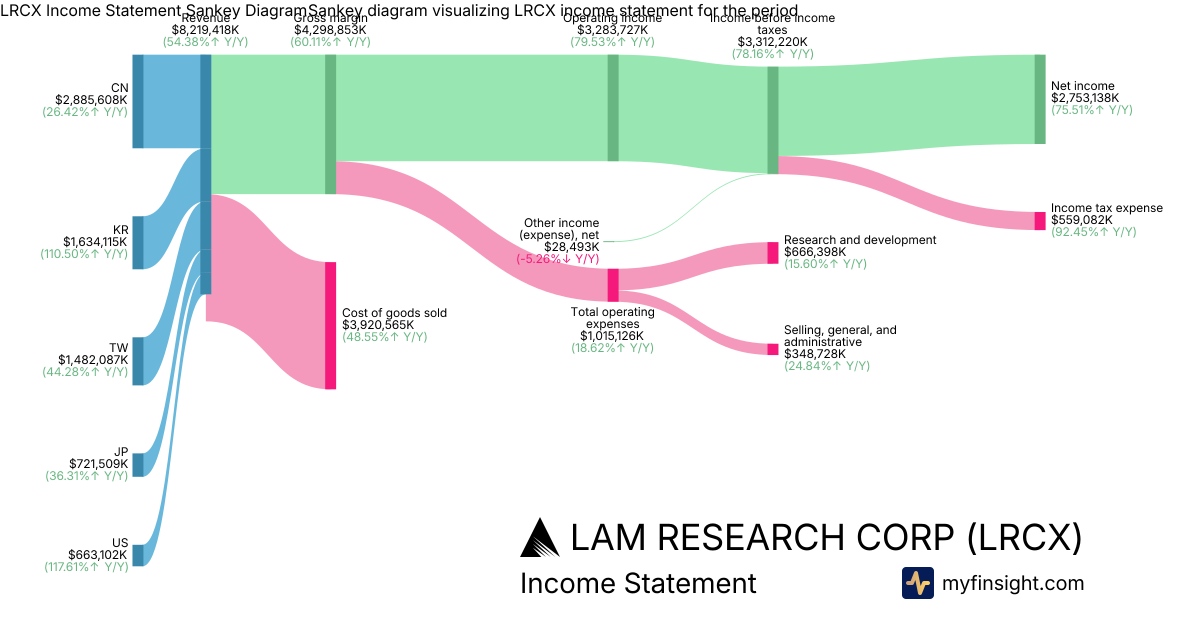
- Record Earnings and Profitability: Lam Research delivered unprecedented Q1 2027 results, with revenue reaching $8.22 billion, marking a 54.4% year-over-year increase and beating analyst estimates. The company also achieved a record non-GAAP gross margin of 52.4% and an operating margin exceeding 40% for the first time.
- AI-Driven Demand for Semiconductor Equipment: A primary tailwind is the robust and increasing demand for advanced semiconductor manufacturing equipment, critical for artificial intelligence (AI) infrastructure, high-bandwidth memory, and increasingly complex chip designs. This structural shift is expanding Lam Research's addressable market.
- Disappointing Forward Guidance: Despite strong current performance, the stock declined by as much as 9% after the company provided a December quarter (Q2 2027) revenue forecast of approximately $8.6 billion, which was below some analysts' higher expectations.
- Supply Chain Constraints and China Demand: Management attributed the more conservative Q2 2027 guidance to ongoing supply chain bottlenecks limiting near-term growth and a slower sequential revenue step-up due to reduced purchases from domestic Chinese customers.
- Overvaluation Concerns: Prior to the earnings call, LRCX was noted to be trading at a significant premium to its historical earnings multiples and intrinsic value estimates, suggesting that high market expectations were already priced into the stock, making it susceptible to negative reactions even on otherwise strong reports.
|
|
Revenue
$8.22B
|
|
Net Income
$2.75B
|
|
Net Margin
33.50%
|
|
🔍 Deep Dive: PROCTER & GAMBLE Co
Period Ending 2026-09-30
|
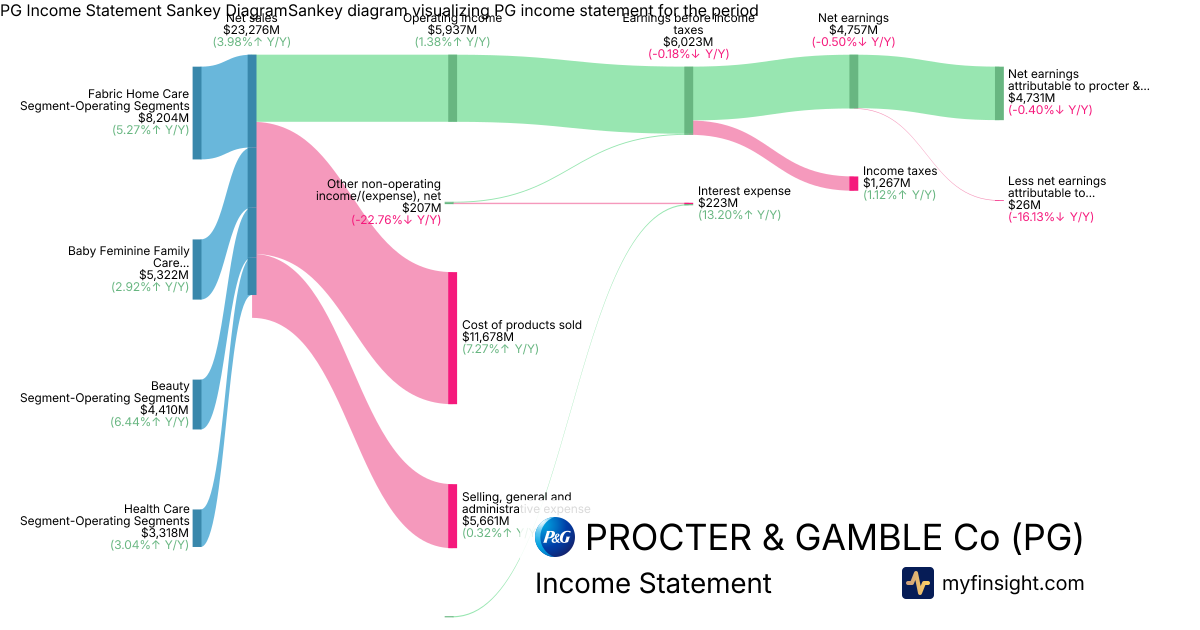
- Strong Financial Performance Exceeding Expectations: Procter & Gamble reported robust net sales of $23.3 billion, surpassing Wall Street expectations. The company also delivered core earnings per share that beat analyst estimates.
- Robust Organic Sales Growth: The company achieved a strong 4.0% organic sales growth, which was broad-based across all product categories and regions, indicating healthy underlying business momentum.
- Key Segment Contributions and Solid Profitability: The Fabric & Home Care segment was a significant contributor with $8.2 billion in sales. Overall, net earnings attributable to Procter & Gamble stood at $4.73 billion, demonstrating solid profitability.
- Resilient Outlook Amidst Cost Headwinds: Management maintained its full-year outlook despite facing challenges from rising commodity, energy, and transportation costs. The company plans to address inflationary pressures through productivity, strategic pricing, and innovation.
- Significant Shareholder Returns and Healthy Liquidity: P&G returned $3.9 billion of cash to shareholders through dividends and share repurchases during the quarter. The company maintained a strong liquidity position with cash and cash equivalents at $15.4 billion.
Overall Takeaway
The recent earnings call for Procter & Gamble was broadly positive. The company exceeded both revenue and earnings expectations, showcased robust organic sales growth across its diverse portfolio, and reaffirmed its full-year guidance despite navigating significant cost challenges. This strong performance, coupled with substantial cash returns to shareholders, reflects a resilient business model and effective management strategies in a dynamic economic environment.
|
|
Revenue
$23.3B
|
|
Net Income
$4.73B
|
|
Net Margin
20.33%
|
|
🔍 Deep Dive: ROLLINS INC
Period Ending 2026-09-30
|
|
🚨 Price Alert: The stock price jumped by 8.21% around the earning call.
|
Rollins (ROL) has recently experienced significant price fluctuations primarily driven by its third-quarter 2026 earnings report, which revealed a miss on revenue expectations and a subsequent revision of its full-year organic growth outlook. Challenges in residential customer acquisition, largely influenced by evolving AI-driven search methodologies, further contributed to market uncertainty.
Key Factors Contributing to Volatility:
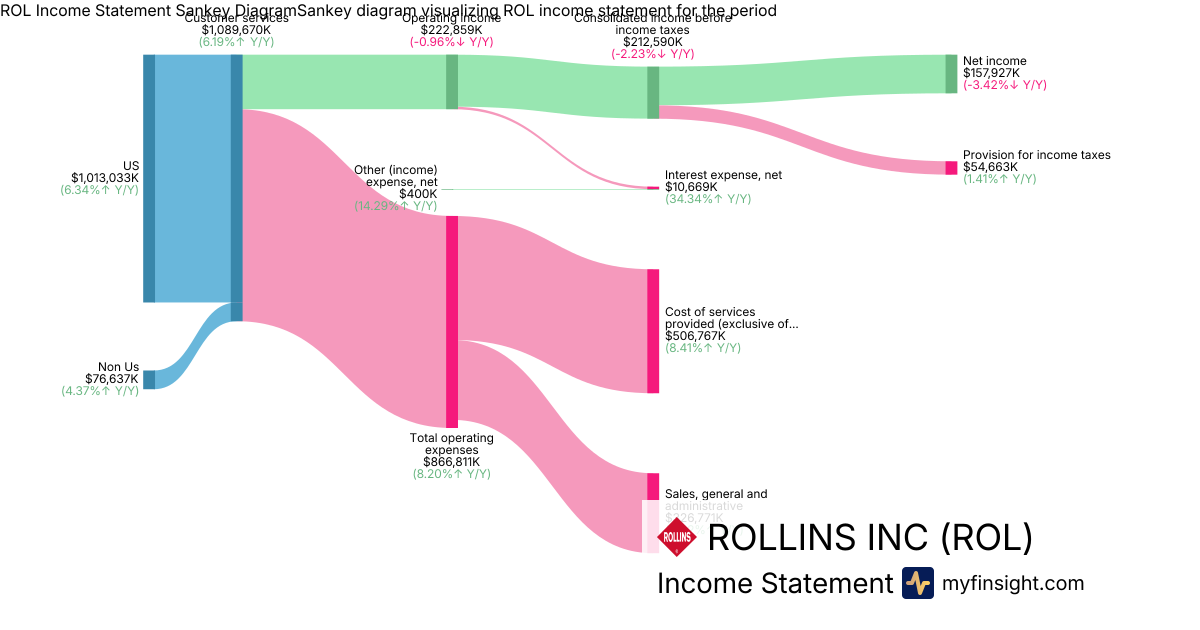
- Q3 2026 Earnings Miss and Revised Outlook: Rollins reported third-quarter 2026 revenue of $1.09 billion, which fell short of analyst estimates. This miss, coupled with a lowered full-year organic growth guidance to 4-6% from a previous 6%, signaled softness in core business performance.
- Residential Customer Acquisition Challenges: A significant driver of concern is the pressure on residential customer acquisition, which management attributes to "AI and LLM-driven search" profoundly changing how consumers discover service providers. This has led to a more fragmented and dynamic lead generation environment, particularly impacting brands like Orkin.
- Gross Margin Compression: The company experienced a contraction in its gross margin by 90 basis points to 53.5% in Q3 2026. This was primarily due to increased operating costs, including rising insurance and claims costs, as well as higher fuel expenses.
- Slowing Organic Growth: Overall organic growth slowed to 4.4% in the third quarter, missing prior expectations and falling below the company's long-term target of 7-8% for the third consecutive quarter. Residential organic growth was notably weaker at 2.3%.
- Analyst Downgrades and Increased Short-Term Debt: The earnings results and revised outlook led to several analyst downgrades and price target cuts, reflecting cautious sentiment regarding the company's near-term prospects. Additionally, the company's short-term debt increased to $240 million at September 30, 2026, from year-end 2025, adding another element of financial scrutiny.
|
|
Revenue
$1.09B
|
|
Net Income
$158M
|
|
Net Margin
14.49%
|
|
🔍 Deep Dive: SOUTHWEST AIRLINES CO
Period Ending 2026-09-30
|
|
🚨 Price Alert: The stock price jumped by 6.84% around the earning call.
|
Southwest Airlines (LUV) recently experienced significant price fluctuations around its third-quarter 2026 earnings call. This volatility appears to be primarily driven by a strong beat on Q3 earnings and record revenue performance, which was tempered by substantial increases in fuel costs and a subsequent downward revision of the full-year profit outlook. The market reacted to both the impressive short-term results and the cautious long-term guidance influenced by macro factors.
Key Factors Contributing to Volatility:
- Record Revenue Growth: Southwest Airlines reported record third-quarter operating revenues of $8.4 billion, an increase of 21.2% year-over-year, largely driven by strong demand for its enhanced product and increased passenger yields. Passenger revenue itself rose 22.8% to $7.75 billion.
- Strong Earnings Beat and Margin Expansion: The company posted adjusted earnings per share of $0.66, significantly beating analyst estimates, and achieved a 5.4% adjusted operating margin, up 4.8 points year-over-year. Net income reached $270 million.
- Significant Fuel Cost Headwinds: Despite strong revenue, the airline faced an $821 million increase in nominal fuel costs year-over-year, with total aircraft fuel and related taxes amounting to $2.15 billion. Total operating expenses increased 16.3% to $8.0 billion.
- Revised Full-Year Profit Outlook: Due to the persistent impact of rising fuel prices, Southwest Airlines lowered its adjusted earnings per share forecast for the full year 2026, moving the range from $3.25-$4.25 to $2.60-$2.85, which likely weighed on investor sentiment despite the strong Q3 performance.
- Strategic Initiatives and Future Outlook: Management highlighted the positive impact of transformation initiatives and strong demand for its enhanced offerings. The company plans to host a Capital Markets Day in March 2027 to outline its multi-year financial framework and path to further margin expansion, signaling confidence in long-term value creation.
|
|
Revenue
$8.42B
|
|
Net Income
$270M
|
|
Net Margin
3.21%
|
|
🔍 Deep Dive: Element Solutions Inc
Period Ending 2026-09-30
|
|
🚨 Price Alert: The stock price dropped by 7.67% around the earning call.
|
Element Solutions Inc. (ESI) recently experienced significant price volatility around its Q3 2026 earnings call, where shares fell despite the company reporting record financial results. The primary drivers behind this "sell-the-news" reaction appear to be investor focus on forward guidance, valuation concerns, and mixed performance across its business segments.
Key Factors Contributing to Volatility:
- Record Q3 Performance Exceeded Expectations: Element Solutions reported record net sales of $995 million, representing 52% year-over-year growth and 13% organic growth, alongside adjusted earnings per share of $0.50, which surpassed Wall Street estimates. Net income for the quarter was $65.7 million, a 67% increase from the prior year.
- Focus on Sequential Q4 Decline: Despite strong Q3 results, the stock declined as investors reacted to management's guidance for an expected sequential decrease in adjusted EBITDA for the fourth quarter, attributed to normal seasonality and holiday shutdowns.
- Valuation Concerns and Profit-Taking: ESI's stock was trading at a premium valuation, leading to profit-taking after a strong run-up prior to the earnings announcement, as investors questioned the sustainability of growth at current levels.
- Electronics Segment Outperformance: The Electronics segment was a significant growth driver, with $780 million in net sales (18% organic growth), fueled by robust demand related to AI infrastructure, advanced semiconductor packaging, and high-performance computing applications.
- Specialties Segment Underperformance: Conversely, the Specialties segment, which contributed $216 million in net sales, continued to underperform, particularly its energy vertical, which experienced a 13% organic decline due to customer equipment downtime and project delays.
|
|
Revenue
$995M
|
|
Net Income
$65.7M
|
|
Net Margin
6.60%
|
|
🔍 Deep Dive: INTERNATIONAL BUSINESS MACHINES CORP
Period Ending 2026-09-30
|
|
🚨 Price Alert: The stock price jumped by 10.63% around the earning call.
|
IBM (IBM) experienced significant stock price fluctuations around its recent earnings call, driven by a combination of strong third-quarter results that surpassed analyst expectations and cautious commentary from its CEO regarding the measurable returns of artificial intelligence (AI) investments. The market's reaction also reflected a lingering impact from the prior quarter's performance and investor interpretation of the company's full-year outlook.
Key Factors Contributing to Volatility:
- Robust Q3 Earnings Beat: IBM reported strong third-quarter 2026 results, with total revenue of $17.1 billion, surpassing consensus estimates. Adjusted earnings per share also exceeded expectations, reflecting disciplined execution.
- Software Segment Outperformance: The Software division was a primary growth driver, with revenue increasing by 8% to $7.8 billion. This was bolstered by strong performance in Red Hat and hybrid cloud revenue, as well as a significant rebound in Transaction Processing software due to the closure of deals that had slipped from the previous quarter.
- CEO's AI Spending Caution: Despite the earnings beat, CEO Arvind Krishna's remarks on the earnings call, expressing corporate clients' concerns about the tangible returns on AI spending, tempered investor enthusiasm and triggered a stock decline.
- Maintained Full-Year Guidance: IBM maintained its full-year 2026 revenue growth outlook of 4-5% (constant currency). This decision, following a strong Q3 beat largely attributed to recovering deferred deals, suggested to some investors that the quarterly acceleration might not be indicative of broader, sustained growth.
- Prior Quarter's Miss Hangover: Investor sentiment was also influenced by the weak second-quarter performance, where both profit and revenue missed forecasts. While Q3 showed recovery, the context of the prior miss contributed to heightened scrutiny and volatility around the current results.
|
|
Revenue
$17.1B
|
|
Net Income
$2.19B
|
|
Net Margin
12.80%
|
|
🔍 Deep Dive: Liberty Energy Inc.
Period Ending 2026-09-30
|
|
🚨 Price Alert: The stock price dropped by 14.65% around the earning call.
|
LBRT has recently experienced significant price fluctuations around its earnings call, primarily driven by a reported net loss stemming from substantial investment write-downs, which overshadowed otherwise robust revenue and operating income from its core business operations.
Key Factors Contributing to Volatility:
|
|
Revenue
$1.2B
|
|
Net Income
-$39.1M
|
|
Net Margin
-3.27%
|
|
🔍 Deep Dive: Allegion plc
Period Ending 2026-09-30
|
|
🚨 Price Alert: The stock price jumped by 15.75% around the earning call.
|
Allegion (ALLE) recently experienced significant price volatility, primarily an upward surge, following its strong third-quarter 2026 earnings call on October 22, 2026. The company's results notably surpassed analyst expectations, coupled with an optimistic outlook for the full year, ignited substantial investor confidence.
Key Factors Contributing to Volatility:
- Exceeded Earnings and Revenue Estimates: Allegion reported robust third-quarter 2026 financial results, with net revenues of $1.17 billion and net earnings of $221 million. Both figures comfortably beat consensus analyst estimates, which were $1.14 billion for revenue and $2.50 for adjusted EPS.
- Raised Full-Year 2026 Outlook: The company significantly raised its full-year 2026 adjusted EPS guidance to a range of $9.05-$9.10, exceeding the previous analyst consensus. Allegion also increased its reported and organic revenue growth outlook, signaling sustained positive momentum.
- Strong Americas Segment Performance: A primary driver of growth was the Allegion Americas segment, which generated revenues of $942 million. This segment demonstrated robust organic growth, particularly in the non-residential market, highlighting strong underlying demand.
- Expanded Operating Margins: Allegion achieved an expanded adjusted operating margin of 24.7%, reflecting effective pricing strategies, productivity gains, and volume leverage, which contributed to a strong operating income of $285 million.
- Market Reaction and Investor Confidence: The combination of better-than-expected financial results and a raised outlook led to a substantial positive market reaction, with ALLE shares jumping approximately 10-11% on the day of the earnings announcement, indicating renewed investor confidence.
|
|
Revenue
$1.17B
|
|
Net Income
$221M
|
|
Net Margin
18.84%
|
|
🔍 Deep Dive: DOVER Corp
Period Ending 2026-09-30
|
- Strong Q3 Performance and Accelerated Organic Growth: Dover reported total revenue of $2.23 billion, exceeding estimates. Organic growth accelerated to 7% in Q3 2026, driven by secular growth markets.
- Record Bookings and Backlog for Future Visibility: Orders surged 16% year-over-year across all five segments, leading to a 35% increase in backlog, with approximately half scheduled to ship in 2027, providing strong momentum and visibility.
- Raised Full-Year Guidance: Management narrowed its full-year 2026 guidance towards the upper end, now projecting organic growth of 5% to 6% and adjusted EPS of $10.60 to $10.75 per share, representing double-digit growth.
- Secular Growth Markets and Segment Strength: Secular growth markets, including data center cooling and energy transition, now comprise over 25% of total revenue. The Climate & Sustainability Technologies segment generated $481 million in revenue, an 18% organic growth, and Clean Energy & Fueling generated $606 million, growing 12% organically.
- Robust Free Cash Flow and Capital Deployment: The company generated $383 million in free cash flow in Q3 (17% of revenue) and repurchased over $330 million in shares during the quarter.
Overall Takeaway
The Q3 2026 earnings call for Dover (DOV) was broadly positive. The company exceeded analyst expectations on both adjusted EPS and revenue, driven by accelerating organic growth, particularly in high-demand secular markets. The significant increase in bookings and backlog provides strong confidence in future performance, which is further supported by an upward revision in full-year guidance and a balanced capital allocation strategy. Despite minor headwinds in one segment and some production ramp-up costs, the overall sentiment points to robust demand and solid execution.
|
|
Revenue
$2.23B
|
|
Net Income
$333M
|
|
Net Margin
14.92%
|
|
🔍 Deep Dive: HONEYWELL INTERNATIONAL INC
Period Ending 2026-09-30
|
- Strong Q3 Performance and Raised Full-Year Guidance: Honeywell reported robust third-quarter 2026 results with total net sales of $4.99 billion, representing 7% organic growth, which exceeded the high end of targets unveiled at its Investor Day. The company also significantly increased its full-year 2026 guidance across key metrics, including organic sales growth and adjusted earnings per share, with the low end of the new EPS guidance now above the previous high end.
- Broad-Based Segmental Strength and Growth Drivers: All three business segments demonstrated strong organic growth, with Building Automation growing 8% (its eighth consecutive quarter of high-single-digit growth), Process Automation & Technology (PA&T) also achieving 8% organic growth driven by a 14% increase in project sales, and Industrial Automation seeing 4% organic growth. Growth was particularly fueled by demand in energy projects and the data center vertical, which experienced over 100% order growth.
- Significant Margin Expansion and Cost Optimization: The company achieved substantial segment margin expansion of 370 basis points, reaching 21.3%. This improvement was attributed to strategic pricing actions, productivity initiatives, and the accelerated elimination of stranded costs following Honeywell's corporate transformation. Management remains on track to complete the elimination of remaining stranded costs by the end of 2026.
- Robust Backlog and Positive Future Outlook: Honeywell ended the quarter with a strong backlog of nearly $19 billion, reflecting a 7% year-over-year increase (excluding divestitures), which provides a solid foundation for future revenue generation. Management highlighted expectations for a multi-year growth inflection in Process Automation & Technology and continued strong performance in Building Automation.
- Improved Free Cash Flow and Disciplined Debt Reduction: Free cash flow increased 15% year-over-year to approximately $688 million, with a strong 95% conversion rate, and is projected to exceed 100% in the fourth quarter of 2026. The company is actively pursuing debt reduction, targeting gross debt to be below $13 billion by year-end, down from $18 billion in the second quarter, aiming for gross leverage below 3 times.
Overall Takeaway
The Q3 fiscal 2026 earnings call for Honeywell was broadly positive. The company exceeded its organic sales growth targets and delivered a significant increase in adjusted EPS. This strong performance, coupled with raised full-year guidance across key financial metrics, broad-based segmental strength, effective cost management leading to margin expansion, and a clear focus on debt reduction, signals robust operational execution and a confident outlook for its pure-play automation strategy.
|
|
Revenue
$4.99B
|
|
Net Income
$664M
|
|
Net Margin
13.30%
|
|
🔍 Deep Dive: Snap-on Inc
Period Ending 2026-10-03
|
- Revenue Miss and Organic Decline: Snap-on reported net sales of $1.18 billion for Q3 2026, falling short of analyst expectations. The company experienced a 0.6% reported increase in net sales but a 2.8% organic sales decline, primarily driven by weaker sales to its mobile van network and reduced OEM-related program activity.
- Earnings Below Expectations: Net earnings attributable to Snap-on were $243 million, or $4.64 per diluted share, missing analyst consensus estimates. This compares to $5.02 per diluted share in the prior year, which included a $0.31 per share after-tax benefit from a legal settlement.
- Impact of Diesel Prices on Tools Group: The Tools Group experienced a 7% organic sales decline as franchisees destocked inventory to generate cash in response to an unprecedentedly accelerated rise in diesel prices, substantially impacting the segment.
- Divergent Segment Performance: The Commercial & Industrial Group delivered a strong performance with sales of $404 million, reflecting a 7.4% organic gain and achieving a record 18.5% operating margin, driven by robust activity in critical industries and specialty torque products. In contrast, the Repair Systems & Information Group's sales were $455 million, a 5.5% organic decrease.
- Operating Margins Decline Amid Gross Margin Resilience: Consolidated operating earnings were $316 million, with the operating earnings margin decreasing to 24.7% from 26.9% in the prior year, partly due to the absence of a non-recurring legal settlement benefit. Despite these pressures, the company maintained a strong gross margin of 51.0%, attributed to Rapid Continuous Improvement initiatives.
Overall Takeaway
The Q3 2026 earnings call for Snap-on was broadly negative. The company missed both revenue and earnings per share expectations, primarily due to significant organic sales declines in its Tools Group and Repair Systems & Information Group, exacerbated by external factors such as rising diesel prices impacting franchisee inventory. While the Commercial & Industrial Group showed strong growth and profitability, and overall gross margins remained resilient, these positives were not enough to offset the broader underperformance.
|
|
Revenue
$98.6M
|
|
Net Income
$243M
|
|
Net Margin
246.45%
|
|
🔍 Deep Dive: NORFOLK SOUTHERN CORP
Period Ending 2026-09-30
|
- Record Revenue and Volume Growth: Norfolk Southern achieved record total railway operating revenues of $3.53 billion, marking a 13.6% year-over-year increase, driven by 3% volume growth across merchandise, intermodal, and coal. The Merchandise segment was a primary contributor, generating $2.19 billion.
- Solid Operating Income Despite Cost Increases: Income from railway operations increased by 7% year-over-year to $1.15 billion. However, total railway operating expenses rose to $2.38 billion, with significant increases attributed to fuel costs ($420 million) and compensation and benefits ($753 million).
- Eastern Ohio Incident and Merger-Related Expenses: The company incurred $28 million in net costs related to the Eastern Ohio incident and $42 million in merger-related expenses, impacting GAAP profitability.
- Strong Adjusted Earnings Per Share: Adjusted diluted earnings per share (excluding the Eastern Ohio incident and merger-related expenses) rose 10% year-over-year to $3.62, exceeding analyst expectations. GAAP diluted EPS was reported at $3.37.
- Updated Capital Spending and Operating Expense Outlook: Norfolk Southern raised its 2026 capital spending forecast to approximately $2.1 billion from $1.9 billion to fund capacity, resiliency, and growth initiatives. The full-year adjusted operating expenses are now expected to exceed $9 billion, including roughly $700 million in additional fuel costs.
Overall Takeaway
The Q3 2026 earnings call for Norfolk Southern was broadly positive. The company delivered record revenue and strong adjusted earnings per share that surpassed analyst expectations, reflecting solid volume growth and effective pricing strategies. While profitability was impacted by non-recurring charges from the Eastern Ohio incident and merger-related expenses, and higher fuel costs influenced operating expenses, the underlying business demonstrated resilience and a commitment to strategic investments for future growth.
|
|
Revenue
$3.53B
|
|
Net Income
$759M
|
|
Net Margin
21.53%
|
|
🔍 Deep Dive: NASDAQ, INC.
Period Ending 2026-09-30
|
|
🚨 Price Alert: The stock price jumped by 12.33% around the earning call.
|
Nasdaq (NDAQ) recently experienced significant price fluctuations around its Q3 2026 earnings call, primarily driven by strong financial results that exceeded analyst expectations and robust performance across key business segments. The company reported a net revenue of $1.48 billion for the quarter, surpassing consensus estimates.
Key Factors Contributing to Volatility:
- Exceeding Earnings Expectations: Nasdaq posted diluted earnings per share (EPS) of $1.04, outperforming analysts' consensus estimates of $1.02, contributing to positive market sentiment. The company also reported a net income attributable to Nasdaq of $540 million.
- Robust Revenue Growth Across Segments: The company achieved strong revenue growth, with net revenue rising 14% year-over-year. This was supported by substantial increases in Solutions revenue, which grew 18%, and particularly strong performance in the Financial Technology segment, which saw a 16% revenue increase. Capital Access Platforms also demonstrated strong growth with a 20% revenue increase.
- Momentum in AI and Cloud Solutions: Nasdaq highlighted increasing client adoption and monetization of artificial intelligence (AI) tools, alongside strong demand for its cloud-based solutions within Financial Technology, with 85% of bookings tied to cloud solutions.
- Record Annualized Recurring Revenue (ARR): The company reported a record Annualized Recurring Revenue (ARR) of $3.4 billion, reflecting a 14% year-over-year increase, underscoring the stability and predictability of its revenue streams.
- Strong Shareholder Returns: Nasdaq demonstrated a commitment to returning value to shareholders, distributing nearly $500 million through dividends and share repurchases during the quarter.
|
|
Revenue
$2.39B
|
|
Net Income
$540M
|
|
Net Margin
22.57%
|
|
🔍 Deep Dive: UNION PACIFIC CORP
Period Ending 2026-09-30
|
|
Revenue
$7.2B
|
|
Net Income
$2.08B
|
|
Net Margin
28.85%
|
|
🔍 Deep Dive: PULTEGROUP INC/MI/
Period Ending 2026-09-30
|
|
🚨 Price Alert: The stock price jumped by 9.26% around the earning call.
|
|
Revenue
$3.97B
|
|
Net Income
$476M
|
|
Net Margin
11.97%
|
|
🔍 Deep Dive: COMFORT SYSTEMS USA INC
Period Ending 2026-09-30
|
|
🚨 Price Alert: The stock price dropped by 17.01% around the earning call.
|
|
Revenue
$3.77B
|
|
Net Income
$489M
|
|
Net Margin
12.98%
|
|
🔍 Deep Dive: VERISIGN INC/CA
Period Ending 2026-09-30
|
|
Revenue
$443M
|
|
Net Income
$212M
|
|
Net Margin
47.97%
|
|
🔍 Deep Dive: CBRE GROUP, INC.
Period Ending 2026-09-30
|
|
Revenue
$11.5B
|
|
Net Income
$443M
|
|
Net Margin
3.85%
|
|
🔍 Deep Dive: LOCKHEED MARTIN CORP
Period Ending 2026-09-27
|
|
🚨 Price Alert: The stock price jumped by 12.96% around the earning call.
|
|
Revenue
$20.7B
|
|
Net Income
$1.84B
|
|
Net Margin
8.91%
|
|
This newsletter is sent from
MyFinsight.com.
Was this email forwarded to you? Sign up here.
Unsubscribe
Copyright © 2026 MyFinsight, All rights reserved.
|