🔗 KINDER MORGAN, INC., 🔗 WESTERN DIGITAL CORP, 🚨 HALLIBURTON CO, 🚨 DOW INC., 🔗 TEXAS INSTRUMENTS INC

|

|
|
Daily Summary
|
October 24, 2026
|
Welcome to your daily digest. Today we are analyzing the latest income statements and filings from:
|
|
|
|
🔍 Deep Dive: KINDER MORGAN, INC.
Period Ending 2026-09-30
|
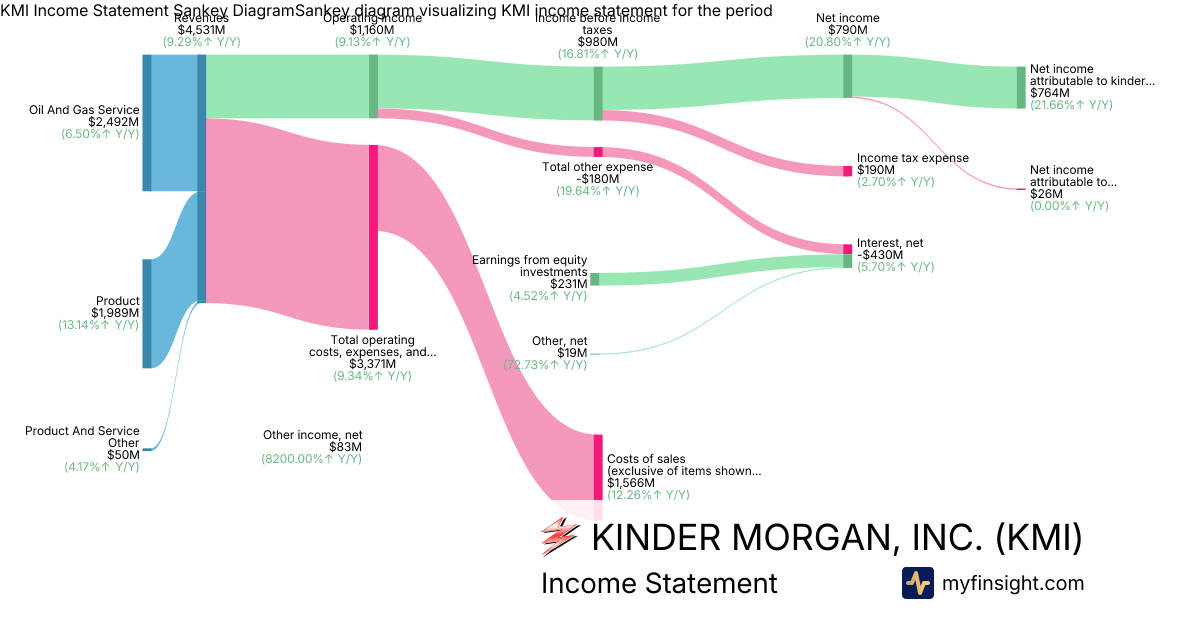
- Strong Q3 Financial Performance: Kinder Morgan reported net income attributable to KMI of $764 million, a 22% increase year-over-year. The company also achieved adjusted EPS of $0.35 and adjusted EBITDA of $2.18 billion, growing 21% and 9% respectively, with all four business segments contributing to this growth. Revenues for the quarter totaled $4.53 billion.
- Record Expansion Project Backlog: The expansion project backlog surged to a record $14.4 billion, reflecting $5.4 billion in new project additions during the quarter. The natural gas project backlog specifically reached a record $13.2 billion, representing approximately 92% of the total expansion backlog. Key new projects include the $3.1 billion Southeast Connector and the Permian Link project.
- Upgraded Full-Year Guidance and Strengthened Financial Position: Kinder Morgan raised its full-year financial outlook, expecting adjusted EPS to exceed its budget by more than 13% and adjusted EBITDA to exceed its budget by more than 6%. The company's financial position continues to strengthen, ending the quarter with a net debt-to-adjusted EBITDA ratio of 3.5 times, at the low end of its targeted range.
- Key Growth Drivers from Natural Gas Demand: Management highlighted strong growth drivers, including rising demand for electricity and global LNG exports. Significant load interconnection requests across the Southeast, exceeding 200 gigawatts, are expected to drive natural gas demand. Additionally, the Permian Link project secured a 20-year take-or-pay contract with an A-rated hyperscaler, demonstrating demand for reliable energy solutions for data centers.
- Non-Recurring Items and Uneven Growth Outlook: Approximately $225 million of the 2026 outperformance was attributed to non-recurring items, such as winter weather impacts, a terminals contract buyout, a FERC rate true-up, and favorable Waha spreads, which are unlikely to repeat. Management cautioned that growth is expected to be uneven, and 2026 results may be difficult to replicate in the following year as major projects contribute proportionally less in their initial years.
Overall Takeaway
The Q3 2026 earnings call for Kinder Morgan was broadly positive. The company delivered strong financial results, significantly expanded its project backlog driven by robust natural gas demand, and upgraded its full-year guidance. While there were contributions from non-recurring items in the current year, the substantial, long-term contracted natural gas projects, particularly those serving electricity generation, LNG exports, and data centers, provide a strong foundation for future performance.
|
|
Revenue
$4.53B
|
|
Net Income
$764M
|
|
Net Margin
16.86%
|
|
🔍 Deep Dive: WESTERN DIGITAL CORP
Period Ending 2026-10-02
|
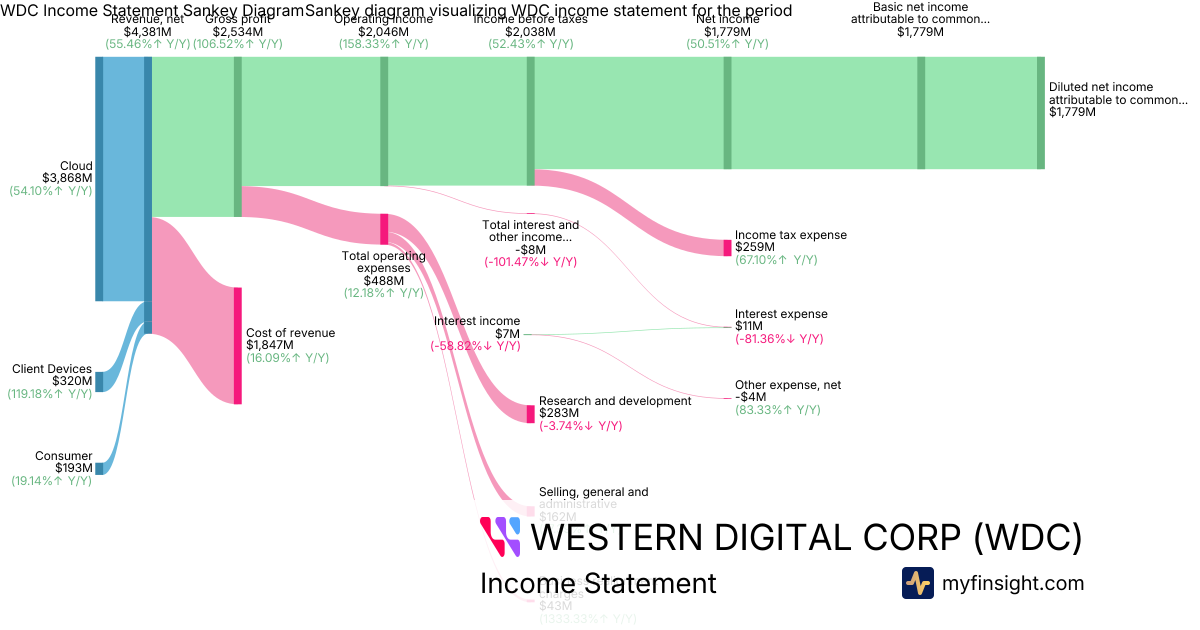
- Strong Financial Performance Exceeding Expectations: Western Digital reported net revenue of $4.38 billion for Q1 fiscal 2027, representing a 55% year-over-year increase and surpassing analyst estimates. The company also achieved a diluted net income attributable to common shareholders of $1.78 billion (non-GAAP EPS of $4.64), beating expectations by 13.73%.
- Robust Profitability and Expanding Margins: Gross profit significantly increased to $2.53 billion, with non-GAAP gross margin expanding to 58.1%, up 1,420 basis points year-over-year. Operating income reached $2.05 billion, reflecting a 49.1% operating margin.
- Cloud Segment and Technology as Key Growth Drivers: The Cloud segment continued to be a primary revenue driver, contributing $3.87 billion, driven by strong demand for high-capacity nearline drives and favorable pricing trends. The company is also making progress with its ePMR and HAMR technology transitions, expecting them to accelerate growth.
- Optimistic Q2 FY2027 Guidance and Increased Shareholder Returns: Western Digital provided strong guidance for Q2 fiscal 2027, projecting revenue of $5.1 billion (+/- $100 million) and non-GAAP EPS of $5.80 (+/- $0.20), both exceeding analyst estimates. The company also demonstrated commitment to shareholders by raising its quarterly cash dividend by 17% to $0.175 per share and returning $1.1 billion through buybacks and dividends in Q1.
- Strategic Adjustments and Market Dynamics: The company recorded $43 million in business realignment charges, indicating ongoing operational streamlining. While the company saw significant pricing gains, management noted that current pricing dynamics might slow after three to four more quarters. Despite strong results, the stock experienced a decline after the announcement, suggesting investor focus on future outlook and potential market shifts.
Overall Takeaway
The Q1 fiscal 2027 earnings call for Western Digital was broadly positive. The company delivered financial results that significantly exceeded expectations across revenue and EPS, driven by robust demand in its Cloud segment and effective pricing strategies. Strong guidance for the next quarter, coupled with an increased dividend and substantial shareholder returns, signals management's confidence in sustained performance. However, investor reaction, with the stock declining despite the beat, suggests some underlying concerns, possibly related to the anticipated slowdown in pricing dynamics or broader market sentiment for high-multiple tech stocks.
|
|
Revenue
$4.38B
|
|
Net Income
$1.78B
|
|
Net Margin
40.61%
|
|
🔍 Deep Dive: HALLIBURTON CO
Period Ending 2026-09-30
|
|
🚨 Price Alert: The stock price jumped by 6.17% around the earning call.
|
Halliburton (HAL) has recently experienced price fluctuations around its earnings calls, primarily driven by a mix of strong international performance, sequential shifts in segment revenues, and a cautious outlook for its North American market. Despite reporting adjusted earnings per share that often beat analyst expectations, investors have reacted to the underlying dynamics of the company's operational results and broader market sentiment.
Key Factors Contributing to Volatility:
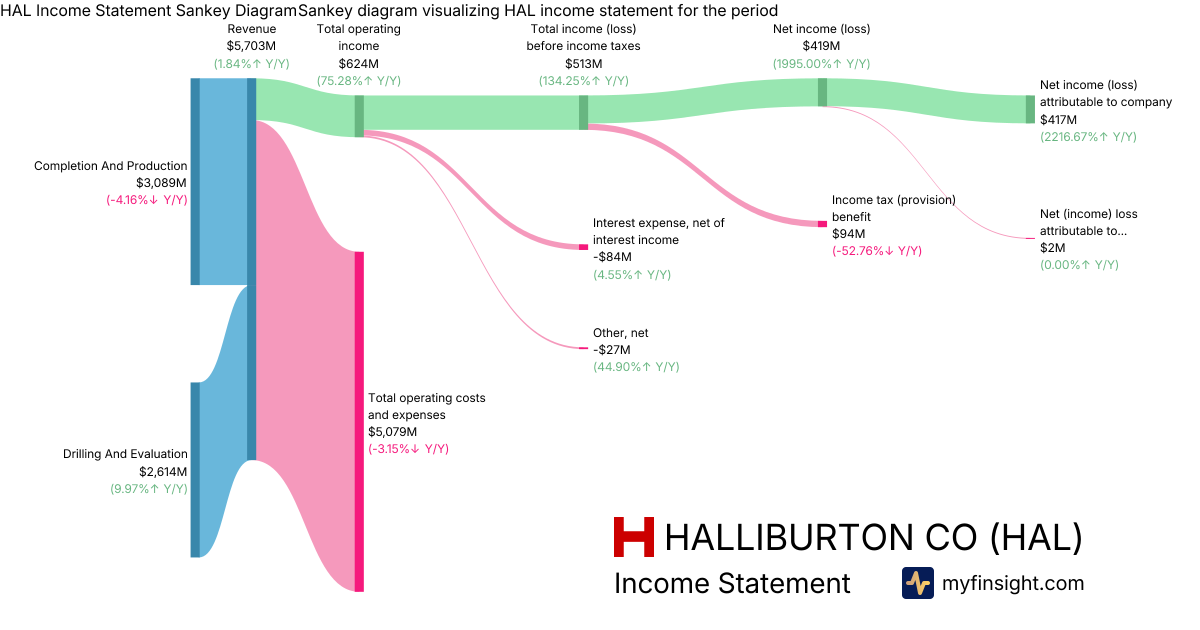
- Mixed Q3 2026 Financial Results: For the third quarter of 2026, Halliburton reported total revenue of $5.7 billion, which was flat sequentially but exceeded analyst consensus. However, net income attributable to the company was $417 million, a decrease from the prior quarter, which may have led to investor concerns despite adjusted earnings beating estimates.
- Divergent Segment Performance: The Completion and Production segment saw revenue of $3.09 billion in Q3 2026, experiencing a sequential decrease primarily due to lower stimulation activity in the Western Hemisphere. Conversely, the Drilling and Evaluation segment's revenue increased to $2.61 billion, fueled by improved activity in the Middle East and Latin America.
- North American Headwinds vs. International Growth: While international revenue grew sequentially to $3.5 billion, North America revenue for Q3 2026 declined sequentially to $2.16 billion due to lower pressure pumping services in U.S. land. The company's 2027 outlook anticipates a flat North American market, with growth driven by international demand in regions like the Middle East ($1.41 billion in Q3 2026) and Latin America ($1.12 billion in Q3 2026).
- Analyst Sentiment and Valuation Concerns: Despite Halliburton beating adjusted EPS estimates in Q3 2026, some analysts noted a miss on EBITDA, and the stock has been perceived as overvalued by certain metrics. This, coupled with reported insider selling, can contribute to investor caution and stock price fluctuations.
- Strategic Operational Improvements: Halliburton is focusing on improving profitability through technology, pricing discipline, and operational efficiency, including a completed SAP S/4HANA system upgrade expected to drive future cost reductions. Management projects mid-single-digit revenue growth and operating margin expansion for 2027, which could mitigate some long-term volatility if achieved.
|
|
Revenue
$5.7B
|
|
Net Income
$417M
|
|
Net Margin
7.31%
|
|
🔍 Deep Dive: DOW INC.
Period Ending 2026-09-30
|
|
🚨 Price Alert: The stock price jumped by 9.95% around the earning call.
|
Dow (DOW) has experienced notable price fluctuations around its recent third-quarter 2026 earnings call, primarily driven by a strong beat on earnings and revenue, bolstered by significant pricing power and the company's "self-help" initiatives. However, broader market challenges such as volume declines and geopolitical impacts in certain regions have introduced volatility.
Key Factors Contributing to Volatility:
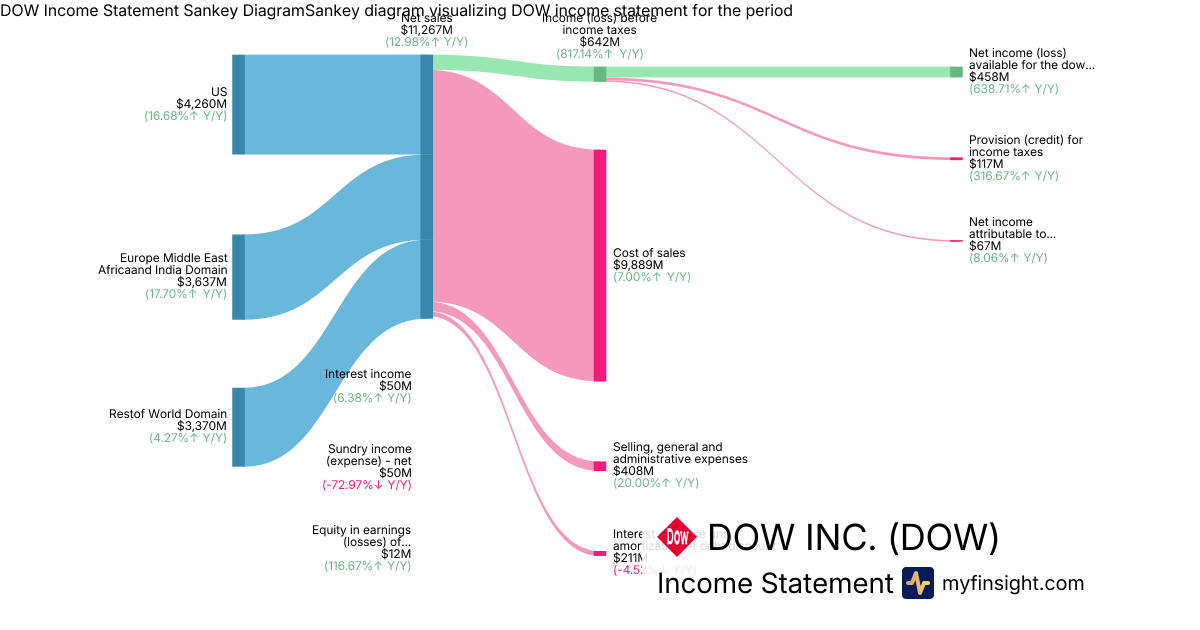
- Robust Q3 2026 Financial Performance: Dow reported strong Q3 2026 results with net sales rising to $11.3 billion, up 13% year-over-year, and GAAP net income reaching $458 million. This exceeded analyst expectations, leading to an initial positive stock reaction.
- Pricing Strength and Margin Expansion: The increase in net sales was largely driven by a 14% rise in local prices, particularly in the Packaging & Specialty Plastics segment, which posted net sales of $5.78 billion. This pricing power, coupled with improved gross margins despite higher raw material costs, contributed significantly to profitability.
- Effective "Self-Help" Actions and Cost Controls: The company's ongoing initiatives, including a $1 billion cost program and "Transform to Outperform" program, contributed to improved operating EBIT and helped offset rising input costs, impacting factors like cost of sales.
- Volume Declines and Geopolitical Headwinds: Overall volume decreased by 1% year-over-year, primarily due to impacts from the Middle East conflict affecting the Asia Pacific region and certain segments like Polyurethanes & Construction Chemicals. This modest volume decline despite strong pricing likely tempered some investor enthusiasm.
- Broader Market and Sector Trends: The chemical sector has faced scrutiny regarding pricing dependence and elevated input costs. Dow's stock movements also reflect broader market dynamics, including rotations between different asset classes and concerns over interest rates and oil prices, contributing to volatility around the earnings period.
|
|
Revenue
$11.3B
|
|
Net Income
$458M
|
|
Net Margin
4.06%
|
|
🔍 Deep Dive: TEXAS INSTRUMENTS INC
Period Ending 2026-09-30
|
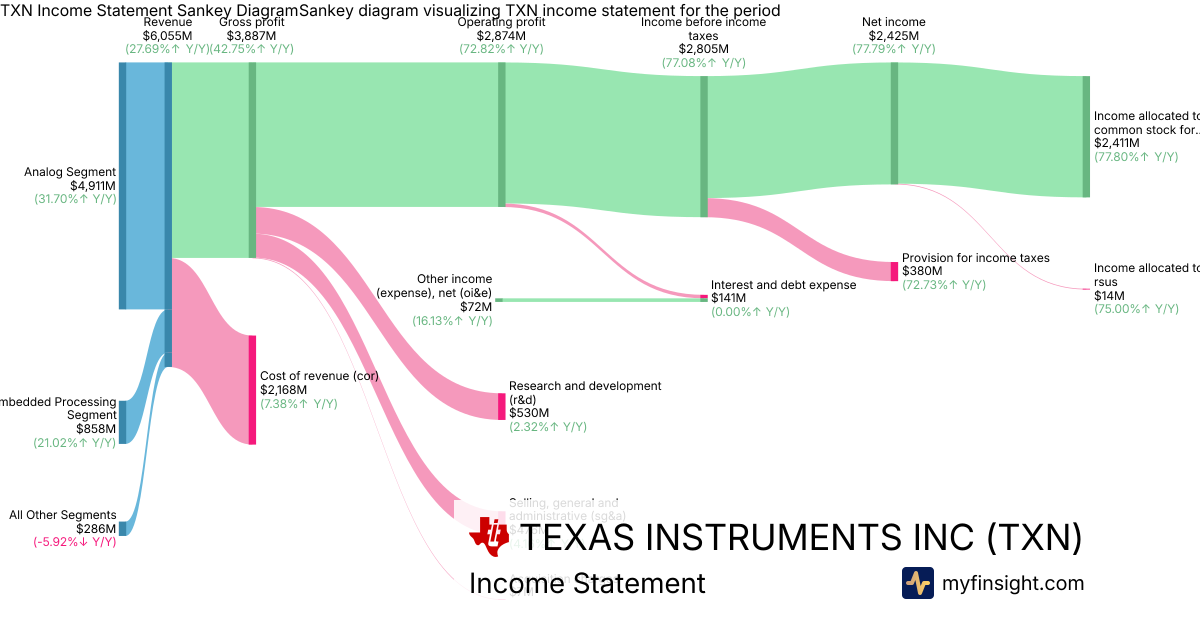
- Strong Q3 2026 Financial Performance: Texas Instruments reported robust third-quarter revenue of $6.05 billion, an increase of 28% year-over-year and 11% sequentially, surpassing analyst expectations. Net income climbed to $2.42 billion, up 78% year-over-year, with diluted earnings per share reaching $2.62, also beating estimates.
- Broad-Based Growth Drivers: The company experienced broad-based demand, particularly with significant growth in industrial, automotive, and data center markets. The Analog segment revenue grew 32% year-over-year to $4.91 billion, and Embedded Processing revenue rose 21% to $858 million.
- Positive Q4 2026 Guidance: Texas Instruments provided an optimistic outlook for the fourth quarter, projecting revenue in the range of $5.80 billion to $6.30 billion and earnings per share between $2.45 and $2.79, which is above analysts' forecasts.
- Strong Cash Position and Shareholder Returns: The company maintained a robust financial standing with $4.21 billion in cash and cash equivalents. Over the trailing 12 months, Texas Instruments generated $9.9 billion in cash flow from operations and returned $5.8 billion to owners, indicating strong capital management and commitment to shareholders.
- Strategic Investments and Operational Efficiency: Texas Instruments maintained a robust operating profit of $2.87 billion, reflecting effective management alongside significant investments totaling $4.0 billion in R&D and SG&A over the past 12 months.
Overall Takeaway
The Q3 2026 earnings call for Texas Instruments was broadly positive. The company exceeded revenue and earnings per share expectations, driven by strong demand across key industrial, automotive, and data center markets. The optimistic fourth-quarter guidance, coupled with robust cash generation and continued shareholder returns, signals confidence in the company's operational execution and strategic positioning for sustained growth.
|
|
Revenue
$6.05B
|
|
Net Income
$2.41B
|
|
Net Margin
39.82%
|
|
🔍 Deep Dive: JABIL INC
Period Ending 2026-08-31
|
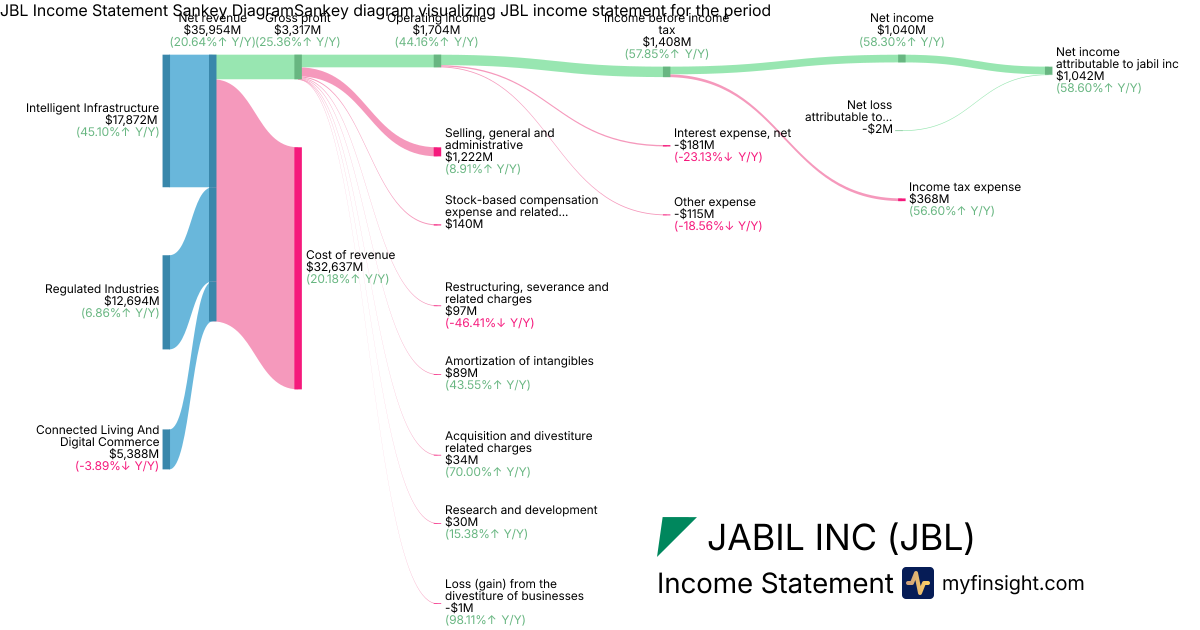
- Strong Fiscal 2026 Performance: Jabil reported fiscal 2026 net revenues of $36.0 billion, representing a 21% increase year-over-year. The company also achieved net income attributable to Jabil Inc. of $1.04 billion, expanded its core operating margin by 40 basis points, and generated over $1.5 billion in adjusted free cash flow, surpassing initial guidance.
- Robust Fiscal 2027 Outlook: Jabil provided a strong outlook for fiscal 2027, projecting total revenue of $44.5 billion, a 24% increase year-over-year. This guidance includes an anticipated 34% growth in core diluted earnings per share to $17.55 and approximately $1.6 billion in adjusted free cash flow.
- AI Infrastructure Driving Growth: The Intelligent Infrastructure segment, which contributed $17.9 billion in revenue for fiscal 2026, is a key growth driver, propelled by accelerating demand in AI infrastructure. AI-related revenue reached $14.4 billion in FY26 and is projected to grow 54% to $22.1 billion in FY27.
- Strategic Operational Shifts: Management emphasized progress in moving up the value chain by embracing more complex engineering and manufacturing solutions. The company also highlighted its efforts to bring new critical capacity online and diversify its customer base across various end markets, including automotive, healthcare, and energy infrastructure.
- Key Risks and Challenges Identified: Notable risks include significant customer concentration, with the top five customers accounting for approximately 37% of net revenue in fiscal 2026, and ongoing supply chain constraints, particularly concerning memory components. Furthermore, the Connected Living business is expected to see a 15% decline in FY2027 due to strategic exits, and margin expansion is anticipated to be back-end loaded due to initial ramp costs.
Overall Takeaway
The recent earnings call for JBL was broadly positive. The company delivered strong financial results for fiscal 2026, exceeding expectations across key metrics like revenue growth, core operating margin expansion, and adjusted free cash flow. The optimistic fiscal 2027 guidance, largely fueled by robust demand in AI infrastructure and a strategic shift towards higher-value solutions, suggests continued positive momentum. While challenges such as customer concentration and supply chain constraints were acknowledged, Jabil's proactive measures in diversification and operational scaling indicate a focused strategy for sustainable growth.
|
|
Revenue
$36B
|
|
Net Income
$1.04B
|
|
Net Margin
2.90%
|
|
🔍 Deep Dive: OMNICOM GROUP INC.
Period Ending 2026-09-30
|
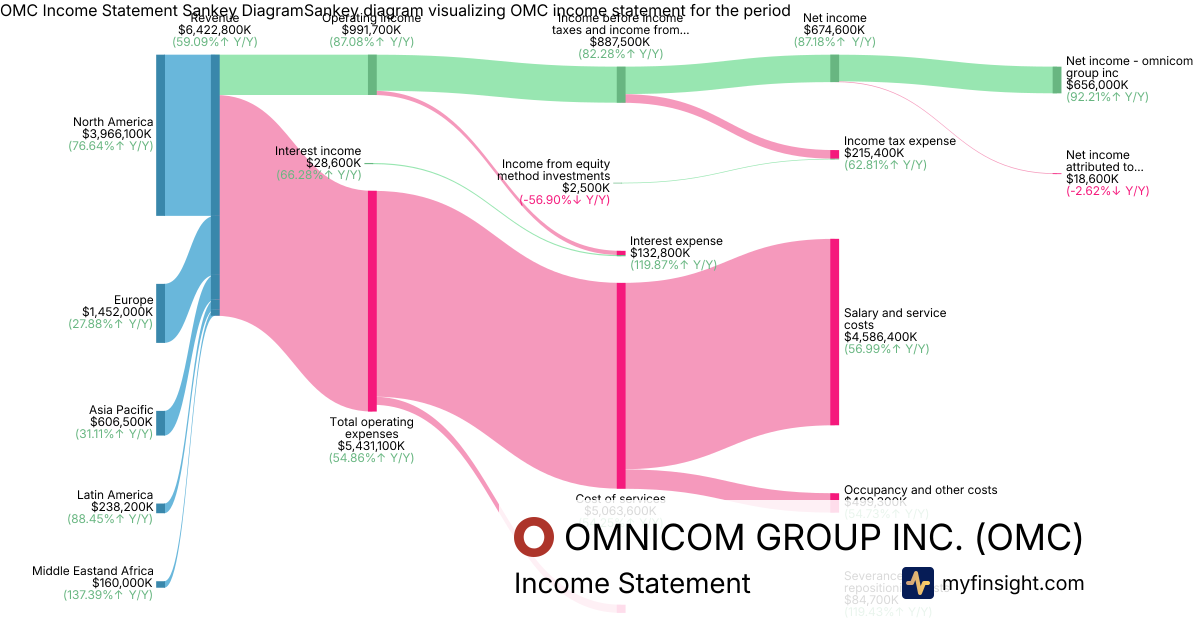
- Strong Organic Growth and Raised Outlook: Omnicom reported robust third-quarter 2026 organic revenue growth of 7.2% from its core operations, largely fueled by a more than 10% increase in Integrated Media. This strong performance led management to raise its full-year 2026 organic core revenue growth guidance to approximately 5%. The company's reported total revenue for Q3 2026 was $6.42 billion.
- Significant Margin Expansion Driven by Synergies: The adjusted EBITDA margin for core operations expanded by 200 basis points, reaching 18.2% in Q3. This improvement is primarily attributed to the successful integration of Interpublic and being on track to deliver $900 million in cost-reduction synergies in 2026.
- Robust Adjusted EPS Growth: Omnicom's adjusted diluted EPS increased by 22% to $2.73, reflecting strong operational performance and the realization of acquisition synergies.
- Strategic Focus on AI and Key New Business Wins: The company continues to invest strategically in agentic AI capabilities and its proprietary Omni marketing intelligence platform. This quarter saw significant new business assignments, including major integrated work for the 2028 Olympic Games, Novo Nordisk, U.S. Bank, L'Oréal, and CVS Health.
- Segment-Specific Headwinds and Increased Interest Expense: While overall results were strong, advertising revenue declined in the mid-single digits, and health revenue was marginally negative in the quarter. Additionally, net interest expense significantly increased to $104 million, primarily due to debt assumed from the Interpublic acquisition.
Overall Takeaway
The Q3 2026 earnings call for Omnicom Group was broadly positive. The company demonstrated strong organic revenue growth and significant margin expansion, largely driven by successful integration efforts and cost synergies from the Interpublic acquisition. While some segments faced headwinds and interest expenses rose, management's updated full-year guidance and strategic focus on AI and new client wins indicate confidence in sustained performance and future growth.
|
|
Revenue
$6.42B
|
|
Net Income
$656M
|
|
Net Margin
10.21%
|
|
🔍 Deep Dive: Philip Morris International Inc.
Period Ending 2026-09-30
|
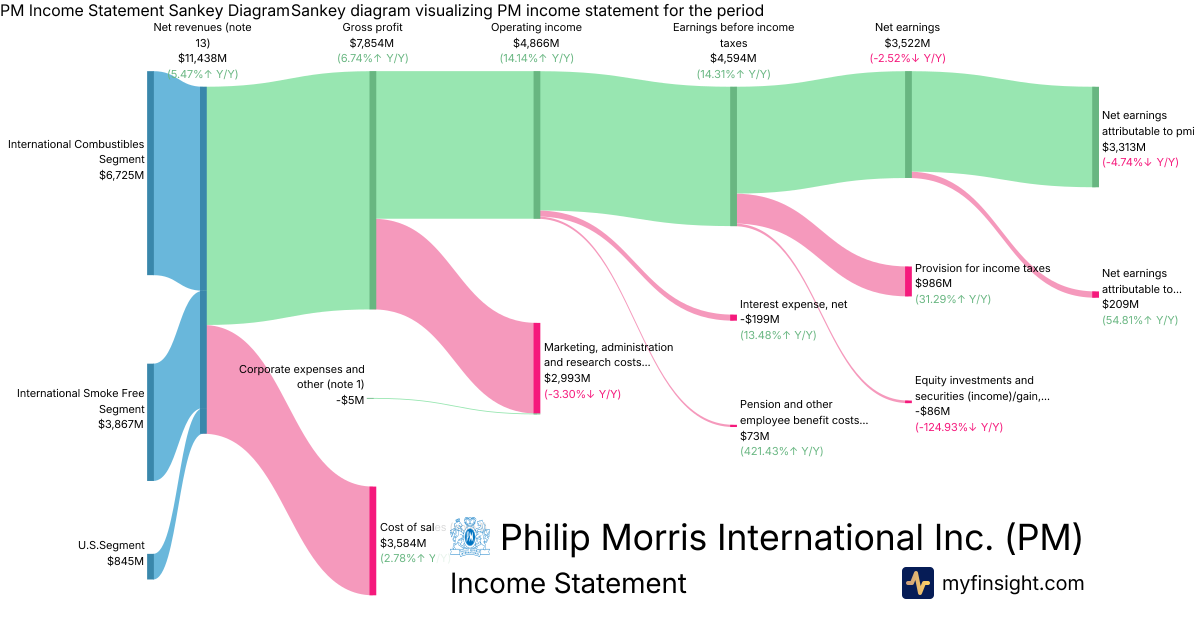
- Strong Top-Line Performance: Philip Morris International reported total net revenues of $11.4 billion, representing a 7.1% organic growth and surpassing analyst estimates. Smoke-free products contributed significantly with $4.62 billion in revenue, now accounting for over 40% of total net revenues.
- Robust Profitability: The company delivered strong profitability with gross profit at $7.85 billion and operating income of $4.87 billion. Net earnings attributable to PMI reached $3.31 billion. The adjusted diluted EPS reached a record $2.36, exceeding analyst expectations.
- Growth Drivers and Strategic Focus: The smoke-free portfolio continues to be a primary growth engine, with IQOS in-market sales increasing by approximately 10% (excluding Japan and Poland) and VEEV shipments up 62%. The International Combustibles Segment also showed resilience, contributing $6.72 billion in revenue.
- Positive Outlook and Shareholder Returns: Philip Morris International projects a second consecutive year of double-digit adjusted diluted EPS growth and anticipates record operating cash flow of approximately $13.5 billion for the full year. The company raised its quarterly dividend by 8.8% to $1.60 per share, marking the 19th consecutive year of increase.
- Strategic Investments and Geopolitical Impacts: The company is making significant commercial investments, particularly in the U.S. ZYN market, which are expected to lead to Q4 U.S. operating income potentially reaching break-even. Geopolitical cost pressures, primarily from Ukraine, tempered full-year EPS growth by one percentage point, even as IQOS gross margins expanded. Marketing, administration, and research costs were $2.99 billion.
Overall Takeaway
The Q3 2026 earnings call for Philip Morris International was broadly positive. The company showcased robust organic revenue growth and strong profitability, significantly driven by its expanding smoke-free product portfolio. Despite facing headwinds from geopolitical cost pressures and making substantial strategic investments in the U.S. market, the reaffirmed positive full-year outlook and a consistent increase in dividends signal management's confidence in sustained performance and commitment to shareholder returns.
|
|
Revenue
$11.4B
|
|
Net Income
$3.31B
|
|
Net Margin
28.96%
|
|
🔍 Deep Dive: AMERICAN EXPRESS CO
Period Ending 2026-09-30
|
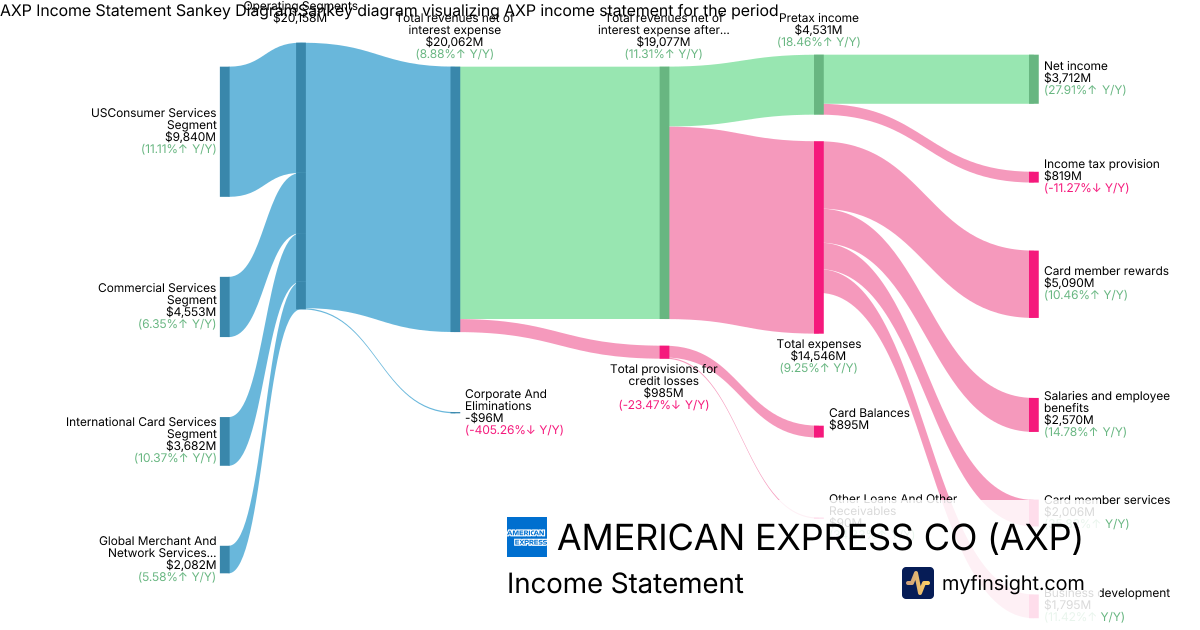
- Strong Financial Performance and Upbeat Guidance: American Express reported robust Q3 2026 results, with total revenues net of interest expense reaching $20.1 billion, marking a 9% year-over-year increase. Net income stood at $3.71 billion, significantly beating analyst expectations. The company reaffirmed its full-year revenue growth guidance of 10% and raised its full-year EPS guidance, reflecting continued confidence in its business momentum.
- Robust Customer Spending and Fee Income Growth: Key growth drivers included strong customer spending, particularly in travel and entertainment, and accelerating net card fees. The US Consumer Services Segment demonstrated significant strength, contributing $9.84 billion in revenues net of interest expense. The company also acquired 3.1 million new cards, with a high percentage on fee-paying products.
- Stable Credit Quality Amidst Growth: American Express maintained strong credit performance, with total provisions for credit losses at $985 million, primarily related to Card Balances. Delinquency rates remained stable for the 15th consecutive quarter, indicating effective risk management despite growth in financing receivables like Card Balances which reached $215 billion.
- Strategic Investments and Discrete Items: The company continued strategic investments in growth, with marketing expenses totaling $1.77 billion. Net income was notably boosted by a $982 million gain from the sale of its Global Business Travel Group (GBTG) equity method investment. However, results also included a significant restructuring charge and increased legal reserves.
- Solid Balance Sheet and Capital Returns: The company's balance sheet remained robust, with total assets reaching $310 billion. American Express returned a substantial $2.2 billion in capital to shareholders during the quarter through share repurchases and dividends.
Overall Takeaway
The Q3 2026 earnings call for American Express was broadly positive. The company delivered strong financial results, exceeding revenue and EPS expectations, driven by robust customer spending and effective card member acquisition. The upward revision of full-year EPS guidance, coupled with stable credit quality and significant capital returns, underscores management's confidence in sustained performance, despite some one-time restructuring charges and legal expenses. While network volume growth was slightly below analyst consensus, the overall picture suggests healthy underlying business momentum and strategic execution.
|
|
Revenue
$20.1B
|
|
Net Income
$3.71B
|
|
Net Margin
18.50%
|
|
🔍 Deep Dive: HUNT J B TRANSPORT SERVICES INC
Period Ending 2026-09-30
|
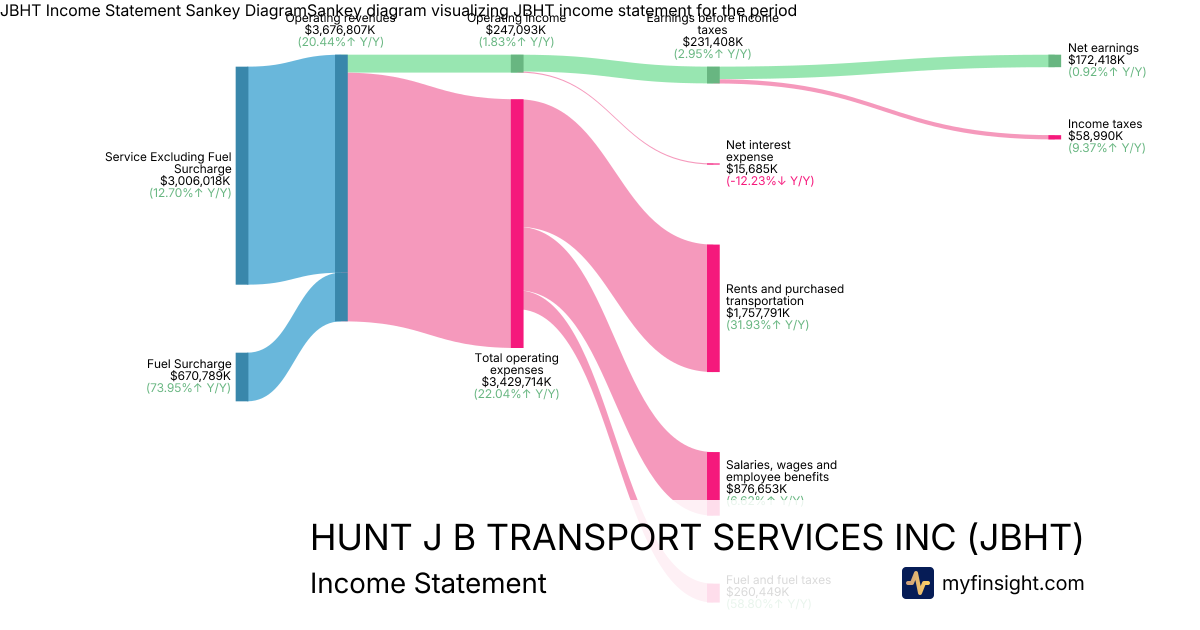
- Revenue Growth Amidst Profitability Headwinds: J.B. Hunt reported $3.68 billion in total operating revenues for Q3 2026, marking a 20% increase year-over-year. However, operating income rose only 2% to $247 million, and diluted earnings per share increased just 3% to $1.82, primarily due to significant cost pressures.
- Robust Intermodal Demand and Capacity Constraints: The Intermodal segment experienced strong demand, with volumes increasing 8% year-over-year and an 18% growth in the Eastern network, reflecting strong road-to-rail conversion. Management indicated that customer demand for intermodal service is currently outpacing available capacity, suggesting potential for future pricing leverage.
- Mixed Performance in Other Segments: Dedicated Contract Services revenue grew 11% to $960 million, and the segment's sales pipeline remains at record levels. Integrated Capacity Solutions saw a substantial 57% revenue increase to $434 million, driven by higher load volumes and rates. Conversely, Final Mile Services revenue decreased 3%, which was attributed to intentional business losses aimed at improving revenue quality.
- Persistent Cost Headwinds and 2027 Margin Focus: The company absorbed over $50 million in sequential cost headwinds, primarily stemming from driver investments, volatile fuel prices, and increased insurance and medical claims. Management highlighted that 2027 margin repair is a top priority, with a strong emphasis on disciplined pricing to ensure rates reflect the value created.
- Strategic Capital Allocation and Outlook: J.B. Hunt maintained its full-year 2026 capital expenditure target of $700 million and repurchased approximately $174 million in stock during the quarter. The company expects pricing gains to support margin repair in the coming quarters, with Intermodal repricing impacting a significant portion of its volume in early 2027.
Overall Takeaway
The Q3 2026 earnings call for J.B. Hunt was **neutral to slightly negative**. While the company achieved strong top-line revenue growth and demonstrated robust demand in key segments like Intermodal and Integrated Capacity Solutions, profitability was significantly constrained by persistent and substantial cost headwinds. Management's clear focus on aggressive pricing actions and margin repair for 2027 provides a strategic path forward, but the immediate quarter highlighted the ongoing challenges in translating strong demand into proportional earnings growth.
|
|
Revenue
$3.68B
|
|
Net Income
$172M
|
|
Net Margin
4.69%
|
|
🔍 Deep Dive: CME GROUP INC.
Period Ending 2026-09-30
|
- Record Q3 Financial Performance: CME Group reported record third-quarter 2026 revenue of $1.74 billion, an increase of 13% year-over-year, surpassing analyst estimates. Adjusted diluted earnings per share (EPS) also climbed 13% year-over-year to $3.02, exceeding expectations. The company achieved an adjusted operating income of $1.2 billion, up 15% year-over-year, and an adjusted operating margin of 69.4%.
- Exceptional Volume Growth Across All Asset Classes: The quarter saw a record Average Daily Volume (ADV) of 29.4 million contracts, a 16% increase year-over-year. International ADV also reached a record 9 million contracts, growing 22% year-over-year, driven by robust double-digit volume growth across all six asset classes, including a 40% rise in energy products and 28% in agricultural products internationally.
- Record Market Data Revenue and Capital Efficiencies: Market data revenue achieved an all-time quarterly record of $243 million, marking its 34th consecutive quarter of year-over-year growth with a 20% increase. Additionally, CME Group generated a new high of over $100 billion in average daily capital efficiencies, offering substantial margin savings for customers through various cross-margining programs.
- Strategic Product Innovation and Infrastructure Modernization: The company continues to innovate with new product launches, such as Single Stock futures and E-nano Equity Index futures, which are gaining traction. Significant progress is being made on strategic initiatives including the upcoming December 7 launch of CME Securities Clearing and ongoing cloud migration efforts with Google Cloud, expanding market access and services. Proposed Compute futures are also under regulatory review to address risks in AI infrastructure.
- Strong Shareholder Returns and Positive Outlook: CME Group returned nearly $1 billion to shareholders during the quarter through dividends and share repurchases, maintaining its dividend payments for 24 consecutive years. Management expressed confidence, stating that the quarter was one of the strongest in the company's history and anticipating another record year.
Overall Takeaway
The Q3 2026 earnings call for CME Group was broadly positive. The company delivered record financial results, exceeding analyst expectations for both revenue and EPS, driven by robust volume growth across all asset classes and sustained strength in market data. Strategic initiatives in product innovation, clearing services, and cloud migration further underscore a strong operational foundation and a confident outlook for continued performance.
|
|
Revenue
$1.74B
|
|
Net Income
$1.04B
|
|
Net Margin
59.68%
|
|
🔍 Deep Dive: STEEL DYNAMICS INC
Period Ending 2026-09-30
|
- Strong Q3 Financials & Record Steel Performance: Steel Dynamics reported Q3 2026 net sales of $6.51 billion and net income of $756 million, representing significant sequential and year-over-year growth, though slightly below guidance due to mark-to-market adjustments. This was primarily driven by record steel shipments of 3.8 million tons and steel operations generating $1 billion in operating income.
- Aluminum Operations Transitioning to Full Production: The new aluminum flat-rolled mill recorded an operating loss of $26 million, but this marked a 21% sequential improvement. Management confirmed that a surface quality issue that impacted Q3 volumes has been resolved, and operations in October have been excellent, with finished automotive products expected to ship before year-end.
- Robust Steel Fabrication Backlog: The steel fabrication segment delivered $91 million in operating income, an increase from the prior quarter, as increased volume and higher average pricing offset rising raw material costs. The order backlog for steel joists and deck is 50% higher than a year ago, with projects extending well into Q2 2027, indicating strong future demand.
- Strong End-Market Demand and Long-Term Outlook: Demand for steel products remains strong across nonresidential construction, automotive, and energy sectors, supporting a high steel mill utilization rate of 92% compared to the industry average of 80%. Management highlighted manufacturing reshoring and public funding for infrastructure as key drivers expected to sustain robust demand into 2027 and beyond.
- Solid Liquidity and Shareholder Returns: The company generated strong cash flow from operations of $846 million and maintained substantial liquidity of $2.4 billion. Steel Dynamics continued its capital allocation strategy with $591 million in common stock repurchases during 2026.
Overall Takeaway
The Q3 2026 earnings call for Steel Dynamics was broadly positive. Despite a slight miss on EPS due to non-operational hedging adjustments and an operating loss in the ramping aluminum segment, the core steel operations delivered record shipments and strong profitability driven by robust end-market demand and improved pricing. The resolution of the aluminum production issue and a strong fabrication backlog provide a positive outlook for future performance. The company's strong cash generation and liquidity further reinforce a stable financial position.
|
|
Revenue
$6.51B
|
|
Net Income
$756M
|
|
Net Margin
11.61%
|
|
🔍 Deep Dive: LAS VEGAS SANDS CORP
Period Ending 2026-09-30
|
|
🚨 Price Alert: The stock price dropped by 6.89% around the earning call.
|
Las Vegas Sands (LVS) has recently experienced notable stock price volatility following its Q3 2026 earnings call on October 21, 2026, primarily driven by a miss on revenue and earnings expectations, coupled with concerns over softness in the premium gaming segment.
Key Factors Contributing to Volatility:
- Q3 2026 Earnings Miss: LVS reported Q3 2026 net revenues of $3.22 billion, falling short of analyst estimates. Net income attributable to Las Vegas Sands Corp. also declined by 27.4% year-over-year to $304 million, with diluted earnings per share at $0.48, missing consensus forecasts.
- Softness in Premium Gaming: The primary driver for the weaker-than-expected results was attributed to a "softness in the premium gaming segment" across its key markets in Singapore and Macao, characterized by lower high-end visitation and unfavorable gaming hold rates.
- Marina Bay Sands Performance: Marina Bay Sands in Singapore reported adjusted property EBITDA of $590 million, a 20.6% decrease from the prior year, with its net revenues standing at $1.29 billion.
- Macao Operations Mixed Results: While Macao operations' adjusted property EBITDA declined to $529 million, the company achieved notable market share gains, capturing 26.1% of Macao's mass gaming revenue. Gaming volumes also showed growth across all segments in Macao.
- Shareholder Returns and Long-Term Confidence: Despite the operational headwinds, LVS demonstrated confidence in its future by repurchasing $950 million of common stock during the quarter and announcing a 20% increase in its quarterly dividend to $0.36 per share for 2027, signaling a commitment to shareholder value and long-term growth from ongoing investments in its properties.
|
|
Revenue
$3.22B
|
|
Net Income
$304M
|
|
Net Margin
9.45%
|
|
🔍 Deep Dive: QUEST DIAGNOSTICS INC
Period Ending 2026-09-30
|
- Strong Q3 Performance and Raised Full-Year Guidance: Quest Diagnostics reported strong third-quarter 2026 revenues of $3.1 billion, a 10.0% increase year-over-year, with adjusted diluted EPS growing 15.4% to $3.00. The company subsequently raised its full-year 2026 revenue guidance to a range of $12.065 billion to $12.105 billion and adjusted diluted EPS guidance to $11.25 to $11.35.
- Robust Volume Growth Driven by Diverse Channels: The quarter saw a significant 14.5% jump in total requisition volume, with organic volume increasing 14.4%, demonstrating strong demand across physician, hospital, and consumer channels. This growth reflects expanding clinical needs of an aging population and increasing focus on prevention and wellness.
- Strategic Initiatives and New Partnerships: Key growth drivers include a new partnership with Apple Health, allowing iPhone and iPad users to order lab tests directly, and the expansion of the AD-Detect® menu with new Alzheimer's disease blood tests. The consumer health channel is projected to grow over 30% for the full year 2026.
- Operational Efficiency and Margin Expansion: Productivity gains from automation and AI contributed to an expansion of the adjusted operating margin by 40 basis points to 16.7% compared to the prior year. The Invigorate program is on track to deliver 3% annual cost savings.
- Anticipated Regulatory Headwinds and Cybersecurity Disclosure: Quest Diagnostics anticipates an approximately 1% headwind to 2027 revenues from PAMA reimbursement cuts, with a cumulative impact of less than 1.3% through 2029. The company also disclosed a cybersecurity incident involving unauthorized access to a test ordering system, though it has not materially disrupted operations.
Overall Takeaway
The Q3 fiscal 2026 earnings call for Quest Diagnostics was broadly positive. The company delivered strong financial results, beating analyst expectations on both revenue and adjusted EPS, and subsequently raised its full-year guidance. This robust performance was driven by significant volume growth across all channels, strategic advancements in consumer health and specialized diagnostics, and effective operational efficiencies. While potential PAMA reimbursement cuts in 2027 and a recent cybersecurity incident present minor concerns, management's proactive stance and continued investment in growth initiatives indicate a healthy outlook.
|
|
Revenue
$3.1B
|
|
Net Income
$312M
|
|
Net Margin
10.07%
|
|
🔍 Deep Dive: TELEDYNE TECHNOLOGIES INC
Period Ending 2026-09-27
|
- Record Third-Quarter Performance and Upward Revisions: Teledyne Technologies reported its strongest quarterly sales and operating earnings in company history for Q3 2026. The company raised its full-year 2026 sales guidance to $6.625 billion, an 8.3% year-over-year increase, nearly doubling its initial January projection, and also increased its non-GAAP EPS guidance to $25.45 for the full year. This marks the third consecutive quarter of raised guidance.
- Digital Imaging Drives Significant Growth: The Digital Imaging segment was a standout performer, with sales growing 15% (14.3% organic) and operating margin expanding by 376 basis points to 25.4%. This growth was attributed to strong demand for infrared detectors in space imaging and IR subsystems/cameras for unmanned systems.
- Consistent Order Momentum and Robust Backlog: Teledyne demonstrated sustained business momentum, with orders exceeding sales for 12 consecutive quarters. The company boasts a funded backlog of approximately $5.3 billion, providing significant revenue visibility for future periods.
- Strong Free Cash Flow and De-leveraging: The company generated a record third-quarter free cash flow of $319.5 million. Teledyne ended the quarter with net debt of $1.47 billion (calculated from total debt and cash of $562.4 million), its lowest level in six years, indicating strong financial health and flexibility. Share repurchases totaled $224.6 million during the quarter.
- Broad-Based Performance and Positive 2027 Outlook: The company achieved broad-based growth across its defense, space, commercial imaging, and instrumentation markets, with nearly all businesses contributing positively. Management anticipates continued mid- to high-single-digit organic growth into 2027, supported by its balanced portfolio.
Overall Takeaway
The Q3 fiscal 2026 earnings call for Teledyne Technologies was broadly positive. The company delivered record financial results, significantly raised its full-year guidance for the third consecutive quarter, and showcased strong organic growth driven by key segments like Digital Imaging. The robust backlog and strong free cash flow, coupled with a healthy balance sheet, underscore the company's strong operational execution and provide a positive outlook for future performance.
|
|
Revenue
$1.68B
|
|
Net Income
$273M
|
|
Net Margin
16.19%
|
|
This newsletter is sent from
MyFinsight.com.
Was this email forwarded to you? Sign up here.
Unsubscribe
Copyright © 2026 MyFinsight, All rights reserved.
|