🔗 AUTOZONE INC, 🔗 HARTFORD INSURANCE GROUP, INC., 🔗 ALEXANDRIA REAL ESTATE EQUITIES, INC., 🔗 CINCINNATI FINANCIAL CORP, 🔗 Public Storage

|

|
|
Daily Summary
|
October 26, 2026
|
Welcome to your daily digest. Today we are analyzing the latest income statements and filings from:
|
|
|
|
🔍 Deep Dive: AUTOZONE INC
Period Ending 2026-08-29
|
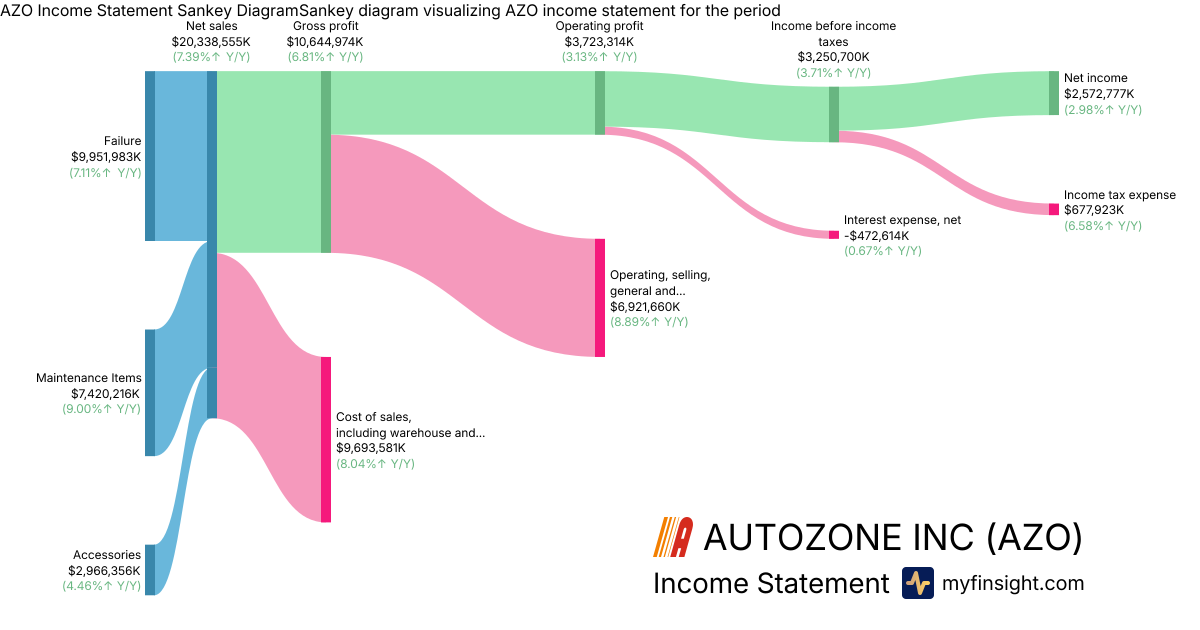
- Strong Top-line Performance: AutoZone reported impressive net sales of $20.3 billion, with U.S. sales accounting for $17.6 billion and international sales at $2.72 billion.
- Solid Profitability: The company demonstrated robust earnings, achieving a gross profit of $10.6 billion and an operating profit of $3.72 billion, culminating in a net income of $2.57 billion.
- Key Revenue Segments: Sales were primarily driven by "Failure" items contributing $9.95 billion, "Maintenance Items" generating $7.42 billion, and "Accessories" adding $2.97 billion, indicating a balanced demand across product categories.
- Significant Inventory Holdings: On the balance sheet, total current assets were $9.11 billion, with merchandise inventories representing a substantial $7.74 billion, highlighting a considerable investment in working capital and product availability.
- Capital Structure Metrics: The company's balance sheet reflects long-term debt of $9.08 billion and a negative total stockholders' deficit of -$2.5 billion, which are critical financial metrics for investors evaluating solvency and financial leverage.
Overall Takeaway
The provided facts exclusively detail financial figures, making it challenging to provide a comprehensive summary of qualitative aspects from an earnings call, such as management commentary, future guidance, growth strategies, or identified risk factors. However, the reported figures demonstrate broadly positive top-line performance and strong profitability. This is tempered by a negative stockholders' deficit and substantial long-term debt, which are critical areas for investor consideration regarding the company's financial structure and long-term stability.
|
|
Revenue
$20.3B
|
|
Net Income
$2.57B
|
|
Net Margin
12.65%
|
|
🔍 Deep Dive: HARTFORD INSURANCE GROUP, INC.
Period Ending 2026-09-30
|
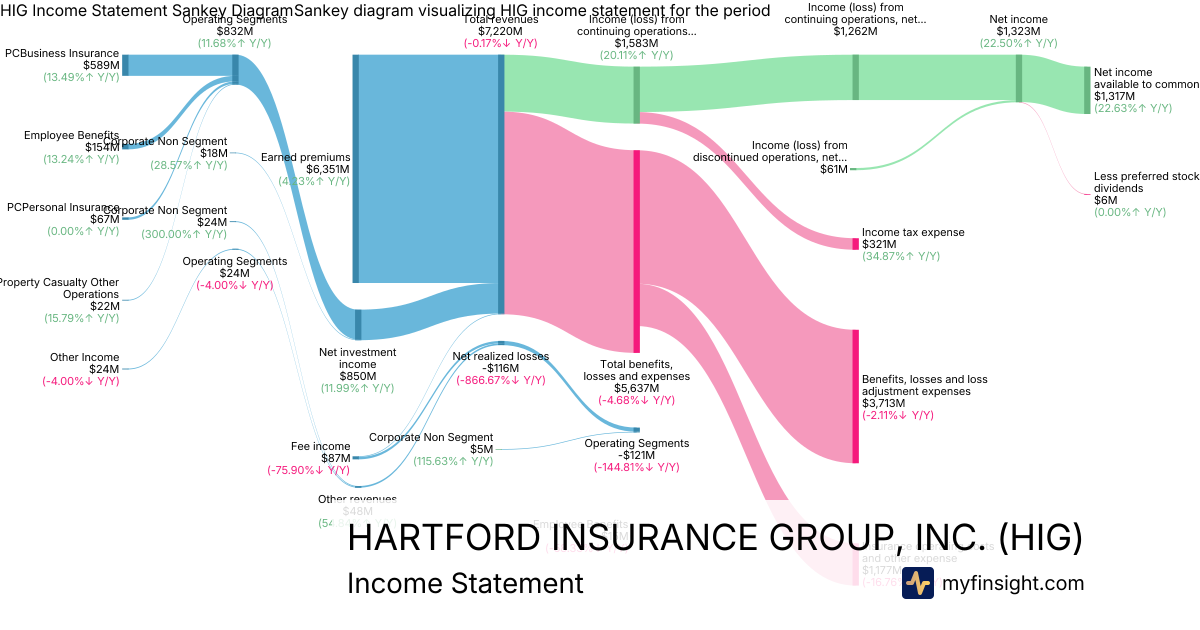
- Strong Earnings Per Share and Underwriting Profitability: The Hartford reported an adjusted EPS of $3.50, significantly beating analyst estimates. This was supported by a strong combined ratio of 81.1%, considerably better than consensus expectations, indicating robust underwriting profitability.
- Mixed Revenue Performance with Strong Premiums: While total revenues of $7.22 billion were flat year-on-year and slightly missed analyst expectations, net premiums earned surged to $6.35 billion, considerably exceeding consensus.
- Segmental Strength and Growth Drivers: Revenue growth was notably driven by strong performance in the Business Insurance and Employee Benefits segments, with the small business insurance segment delivering 8% written premium growth. Conversely, Personal Insurance earned premiums saw a year-over-year decrease of 3.8%.
- Robust Investment Income Amidst Realized Losses: The company generated a healthy net investment income of $850 million, with both Property & Casualty and Employee Benefits segments showing significant year-over-year increases. However, the quarter also saw net realized investment losses of -$116 million, contributing to a comprehensive income loss of $149 million.
- Strategic Focus, Competitive Headwinds, and Shareholder Returns: Management emphasized disciplined underwriting, pricing rigor, and ongoing technology investments, including AI-enabled underwriting, as key to future resilience. Despite facing competitive pressures in personal auto and increased catastrophe losses, the company increased its quarterly common dividend to $0.600 per share.
Overall Takeaway
The Q3 2026 earnings call for The Hartford (HIG) was broadly positive. The company demonstrated strong underlying operational profitability with an exceptional combined ratio and exceeded analyst expectations for adjusted EPS and net premiums earned. While total revenues slightly missed consensus, and realized investment losses impacted comprehensive income, strong net investment income and segmental growth drivers highlight a solid performance. The increase in common dividends further reflects management's confidence in the company's financial health and future outlook.
|
|
Revenue
$7.22B
|
|
Net Income
$1.32B
|
|
Net Margin
18.24%
|
|
🔍 Deep Dive: ALEXANDRIA REAL ESTATE EQUITIES, INC.
Period Ending 2026-09-30
|
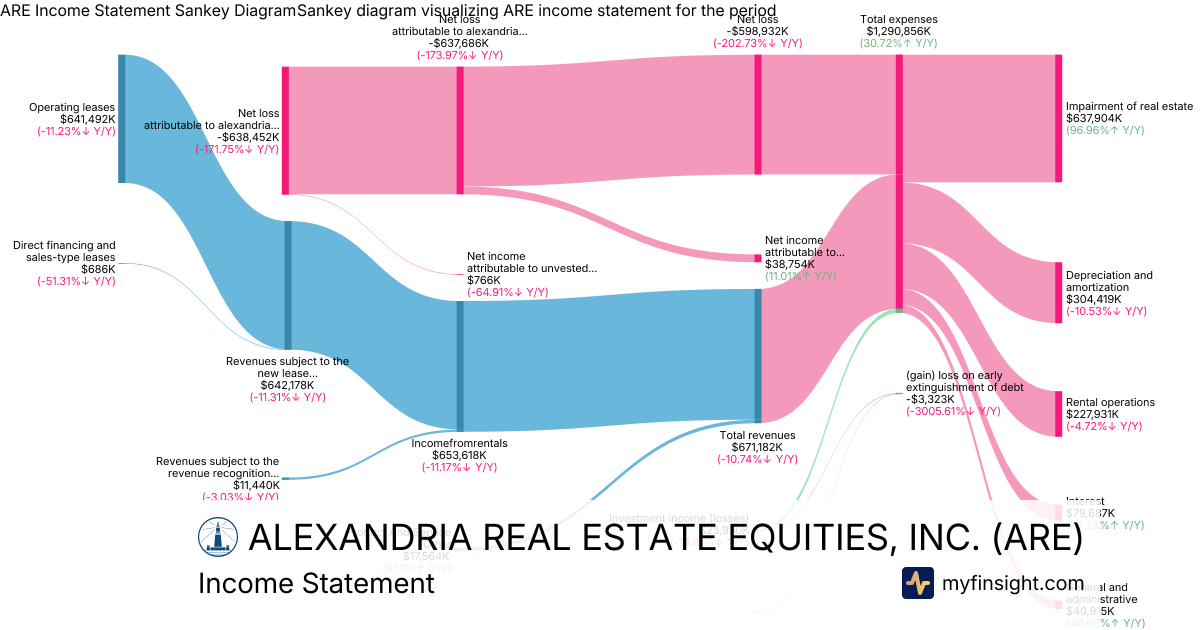
- Significant Net Loss Driven by Real Estate Impairment: Alexandria Real Estate Equities reported a substantial net loss attributable to common stockholders of $638 million in Q3 2026, primarily due to a significant real estate impairment charge of $638 million. This impairment charge surged from $323.9 million in Q3 2025, significantly impacting the quarter's results.
- Revenue Exceeds Estimates Despite Year-over-Year Decline: The company achieved total revenues of $671 million, surpassing consensus estimates. However, this represents a decline from $751.9 million in Q3 2025, with rental income, the primary revenue stream, decreasing to $654 million from $735.8 million year-over-year.
- Adjusted FFO Decline and Occupancy Dip: Adjusted Funds From Operations (FFO) per share was $1.54, falling from $2.22 in Q3 2025, although it beat analyst estimates. Occupancy of operating properties slightly decreased to 88.1% from 91.7% in the year-ago period, contributing to a 2.8% slip in same-property net operating income.
- Full-Year Guidance Maintained Amid Strategic Dispositions: Alexandria Real Estate Equities maintained its full-year 2026 adjusted FFO per share guidance at $6.38-$6.42, with the midpoint unchanged. The company continues its capital allocation strategy, completing $234.4 million in non-core and land dispositions during the quarter and closing the sale of an approximately 29% interest in Campus Point for $475 million in October 2026.
- Balance Sheet and Debt Management: Total assets stood at $34.1 billion. The company saw changes in its debt structure, with junior subordinated notes payable at $985 million and unsecured senior notes payable decreasing to $10.8 billion. Total expenses for the quarter increased to $1.29 billion.
Overall Takeaway
The Q3 2026 earnings call for Alexandria Real Estate Equities was broadly negative. While the company's revenue and adjusted FFO per share slightly exceeded analyst estimates, these positives were overshadowed by a substantial net loss directly attributable to a significant increase in real estate impairment charges. The decline in rental income and same-store net operating income, coupled with a dip in occupancy, indicates ongoing operational headwinds. Despite maintaining full-year guidance and executing strategic dispositions to manage capital, the widening loss and operational challenges present a cautious outlook for investors.
|
|
Revenue
$671M
|
|
Net Income
-$638M
|
|
Net Margin
-95.12%
|
|
🔍 Deep Dive: CINCINNATI FINANCIAL CORP
Period Ending 2026-09-30
|
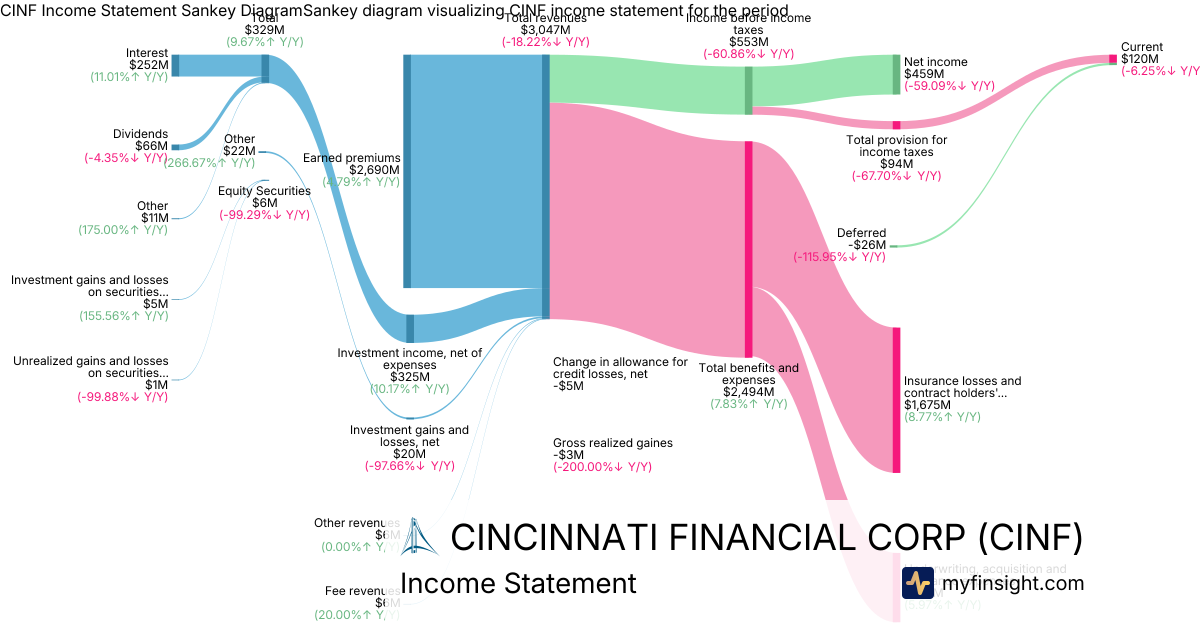
- Exceeding Estimates Despite Lower Net Income: Cincinnati Financial reported adjusted earnings per share of $2.86 and revenues of $3.05 billion for the quarter, both surpassing analyst expectations. However, net income was $459 million, a decrease from the prior year, primarily attributed to significantly lower net investment gains.
- Operational Resilience in Underwriting: The property casualty combined ratio improved to 90.9%, demonstrating strong underwriting efforts and benefiting from $94 million in favorable prior accident year reserve development. This was achieved despite a 7.0 point increase in catastrophe losses compared to the previous year.
- Growth Across Key Insurance Segments and Investment Income: Earned premiums increased to $2.69 billion. Commercial Lines earned premiums grew 3% to $1.27 billion, and Personal Lines earned premiums rose 6% to $889 million. Additionally, net investment income climbed 10% to $325 million pretax.
- Impact of Fluctuating Investment Gains: The company reported net investment gains and losses of $20 million, a significant reduction from $853 million in the comparable prior-year quarter, which negatively affected overall revenue.
- Enhanced Shareholder Value: Book value per share reached $105.42 at quarter-end, reflecting a positive trend. Furthermore, the company demonstrated its commitment to shareholders by increasing its quarterly dividend by 8% to $0.94 per share.
Overall Takeaway
The Q3 2026 earnings call for Cincinnati Financial was neutral to positive. While the company's net income was significantly impacted by lower net investment gains compared to the prior year, its core insurance operations showed resilience with an improved combined ratio and growth in key segments. The beats on adjusted EPS and revenue, coupled with an increased dividend and rising book value, indicate underlying operational strength despite volatility in investment markets.
|
|
Revenue
$3.05B
|
|
Net Income
$459M
|
|
Net Margin
15.06%
|
|
🔍 Deep Dive: Public Storage
Period Ending 2026-09-30
|
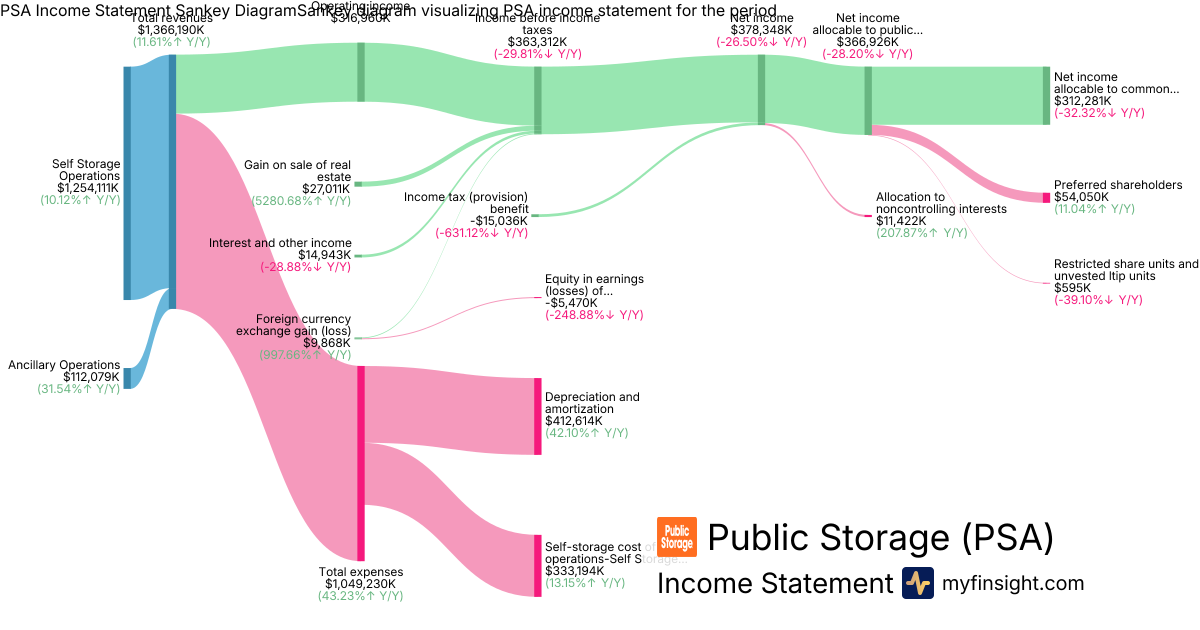
Overall Takeaway
The recent earnings call for Public Storage appears to be neutral. The company demonstrated solid revenue generation from its core self-storage operations and a positive net income. While significant transaction and integration expenses, alongside a non-recurring gain from real estate sales, impacted the results, ongoing construction in process signals continued investment and potential future growth. Investors will likely scrutinize the substantial debt levels in relation to these ongoing development activities.
|
|
Revenue
$1.37B
|
|
Net Income
$312M
|
|
Net Margin
22.86%
|
|
🔍 Deep Dive: BROWN & BROWN, INC.
Period Ending 2026-09-30
|
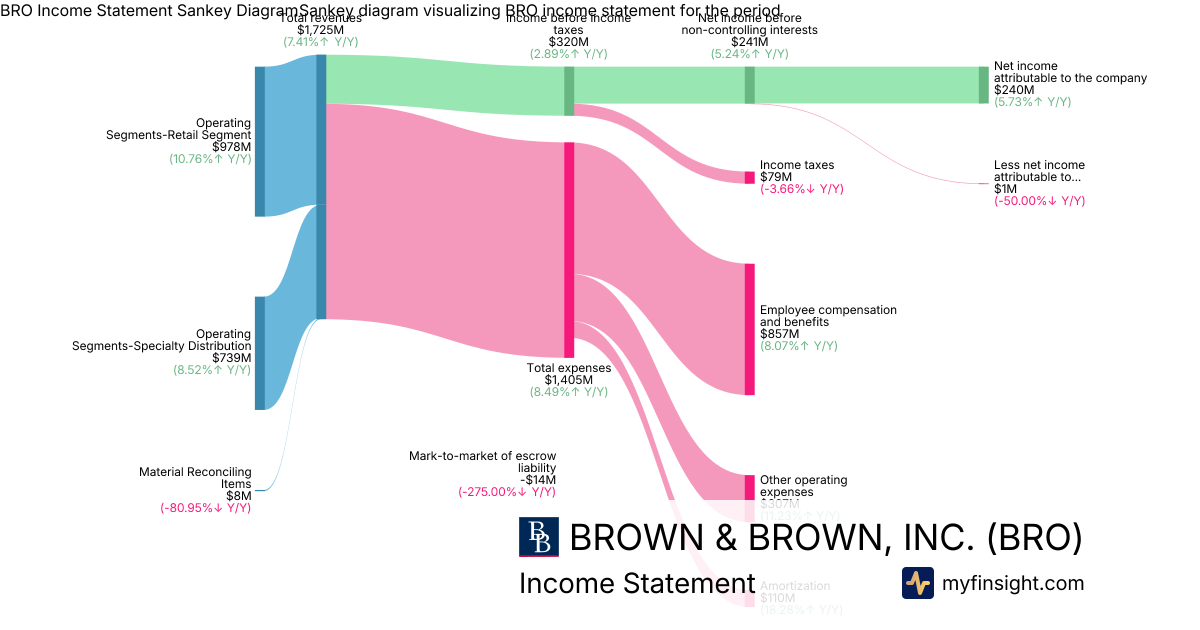
- Solid Revenue Growth: Brown & Brown reported $1.73 billion in total revenues, marking a 7.4% increase year-over-year, with $1.7 billion derived from commissions and fees. Organic revenue grew by 1.2%, or 1.5% including contingent commissions. Both the Retail Segment ($978 million) and Specialty Distribution Segment ($739 million) were key contributors.
- Increased Profitability: Net income attributable to the company rose 5.7% to $240 million. This was achieved amidst significant operating expenses, including $857 million for employee compensation and benefits and $110 million for amortization.
- Strategic Acquisitions and Capital Allocation: The company continues its active acquisition strategy, reflected in $15.2 billion in goodwill and $4.47 billion in amortizable intangible assets. A $23 million favorable change in the fair value of estimated acquisition earn-out payables indicates positive revaluation, and share repurchases remain a capital allocation priority.
- Debt Management and Future Growth Drivers: The company maintains a considerable $7.35 billion in long-term debt, resulting in $100 million in interest expense. Management projects continued revenue growth from recent acquisitions, stable organic performance, and expects AI and data analytics to drive future organic growth and margin expansion.
- Outlook and Risks: Management forecasts organic growth in retail (excluding contingents) at 1.5%-2.5% for the second half and specialty distribution at 2%-4%, with margins expected to remain flat for 2026. The economic outlook remains positive, yet business leaders are cautious due to inflation and geopolitical risks.
Overall Takeaway
The recent earnings call for BRO was broadly positive. The company demonstrated solid year-over-year revenue and net income growth, driven by strong performance in its core Retail and Specialty Distribution segments, coupled with an effective acquisition strategy and favorable revaluation of earn-outs. While maintaining a significant debt profile, management's outlook for continued organic growth, driven by strategic initiatives like AI and data analytics, suggests a stable future, albeit with an acknowledged cautious stance on broader macroeconomic risks.
|
|
Revenue
$1.73B
|
|
Net Income
$240M
|
|
Net Margin
13.91%
|
|
This newsletter is sent from
MyFinsight.com.
Was this email forwarded to you? Sign up here.
Unsubscribe
Copyright © 2026 MyFinsight, All rights reserved.
|