🚨 BOEING CO, 🔗 PayPal Holdings, Inc., 🚨 RANGE RESOURCES CORP, 🚨 INNIO N.V., 🚨 CENTERPOINT ENERGY INC

|

|
|
Daily Summary
|
October 27, 2026
|
Welcome to your daily digest. Today we are analyzing the latest income statements and filings from:
|
|
|
|
🔍 Deep Dive: BOEING CO
Period Ending 2026-09-30
|
|
🚨 Price Alert: The stock price dropped by 12.14% around the earning call.
|
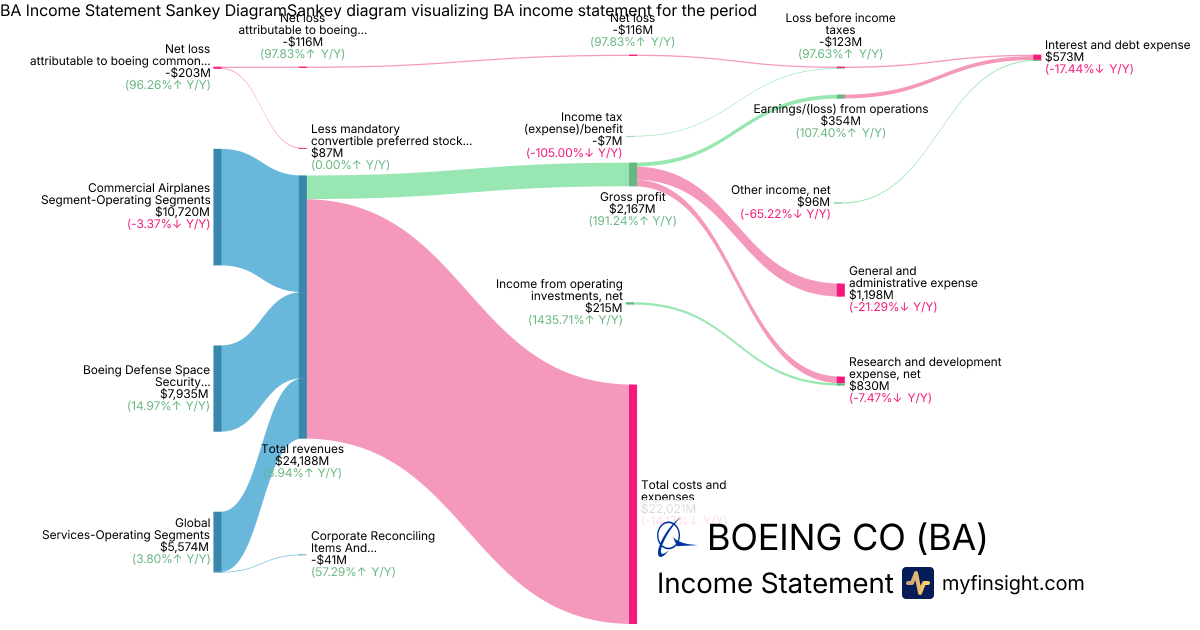
Boeing (BA) stock experienced significant price fluctuations following its Q3 2026 earnings call, primarily driven by concerns over production delays for its crucial 737 MAX jets and a disappointing outlook on future free cash flow. Despite reporting a narrower net loss and increased overall revenue, investor sentiment was negatively impacted by the slower-than-anticipated recovery of its commercial airplane production.
Key Factors Contributing to Volatility:
- Delayed 737 MAX Production and Missed Delivery Targets: Boeing announced delays in reaching its target production rate of 47 737 MAX jets per month until early 2027, pushing back an earlier expectation of achieving this rate by summer 2026. The company also pushed back the target of 52 jets per month to mid-2027 and confirmed it would miss its 2026 delivery target of 500 commercial aircraft.
- Disappointing Free Cash Flow Outlook: Investors reacted negatively to Boeing's revised free cash flow projections, which indicated a slower recovery than analysts anticipated. The company expects to generate approximately $3 billion in free cash flow in 2027 and $6 billion in 2028, falling short of Wall Street's consensus estimates of $5.6 billion and $9.6 billion, respectively.
- Net Loss and Commercial Airplanes Segment Struggles: While Boeing reported a narrowed
net loss attributable to shareholders of -$116 million
in Q3 2026, the Commercial Airplanes unit continued to face challenges, recording a $697 million operating loss. The segment's
$10.7 billion in revenue
was down 3% year-over-year, indicating persistent issues in its core commercial business.
- Overall Revenue Growth Driven by Defense and Services: Despite the struggles in Commercial Airplanes, Boeing's
total revenues rose 4% to $24.2 billion
. This growth was primarily attributed to stronger performance in the Defense, Space & Security segment, which saw
$7.93 billion in revenue
(up 15%), and its Global Services division.
- Record Backlog vs. Production Constraints: Boeing's total backlog reached a record $745 billion, including over 6,300 commercial airplanes, demonstrating strong demand. However, ongoing production issues, particularly related to wing output and broader supply chain constraints, are hindering the company's ability to convert this substantial order book into deliveries and revenue at the pace investors expect.
|
|
Revenue
$24.2B
|
|
Net Income
-$203M
|
|
Net Margin
-0.84%
|
|
🔍 Deep Dive: PayPal Holdings, Inc.
Period Ending 2026-09-30
|
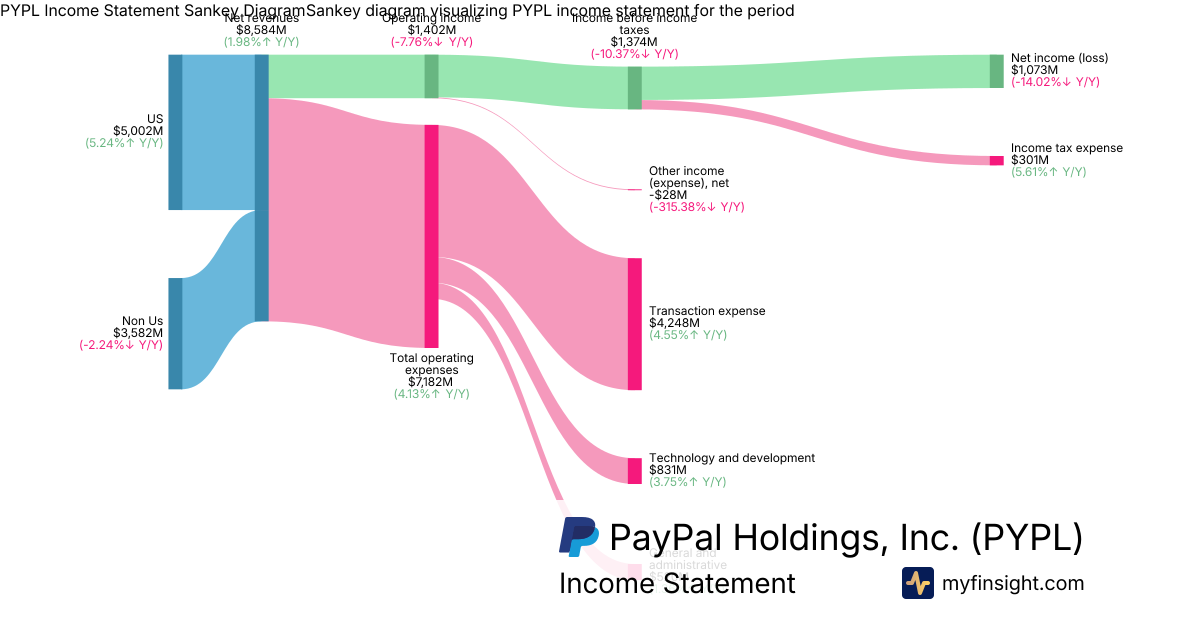
- Mixed Financial Performance: PayPal reported Q3 2026 net revenues of $8.58 billion, a 2% year-over-year increase, which fell short of analyst expectations. Non-GAAP earnings per share (EPS) however, rose 8% to $1.45, exceeding estimates, while GAAP net income declined to $1.07 billion from the prior year.
- Raised Full-Year Guidance & Shareholder Returns: Management raised its full-year 2026 non-GAAP EPS guidance to approximately $5.60 and adjusted free cash flow guidance to at least $6.5 billion. The company affirmed its commitment to returning capital to shareholders, having repurchased shares in Q3 and targeting approximately $6 billion for the full year.
- Key Growth Drivers: Performance was bolstered by double-digit growth in Braintree and Venmo, with Financial Services contributing over 20% of transaction margin dollars. Pay with Venmo and Buy Now, Pay Later (BNPL) volumes also demonstrated strong increases, rising 43% and 25% respectively.
- Strategic Transformation and Cost Management: PayPal is actively pursuing a multi-year transformation, including efforts to simplify its operating model and target at least $1.5 billion in gross run-rate savings, with over $700 million expected by year-end 2026. This is reflected in disciplined non-transaction operating expense growth and $255 million in restructuring and other charges.
- Identified Headwinds: The company faced challenges, including higher contra revenue investments, the impact of the EU de minimis tax exemption removal creating a 70-basis-point headwind, and sluggish branded checkout Total Payment Volume (TPV) growth, particularly in Europe and the U.K. GAAP operating income declined 8% to $1.4 billion.
Overall Takeaway
The Q3 2026 earnings call for PayPal was **mixed**. While the company delivered non-GAAP EPS that exceeded expectations and raised its full-year guidance for key metrics like non-GAAP EPS and free cash flow, it also reported revenue that missed analyst estimates and a decline in GAAP net income. Growth in Braintree, Venmo, and financial services was strong, but headwinds like the EU de minimis tax exemption and sluggish branded checkout performance indicate ongoing challenges, balanced by proactive strategic adjustments and cost management efforts aimed at long-term improvement.
|
|
Revenue
$8.58B
|
|
Net Income
$1.07B
|
|
Net Margin
12.50%
|
|
🔍 Deep Dive: RANGE RESOURCES CORP
Period Ending 2026-09-30
|
|
🚨 Price Alert: The stock price jumped by 30.42% around the earning call.
|
Range Resources (RRC) has recently experienced significant price volatility, primarily driven by the announcement of its acquisition by EQT Corporation, coupled with stronger-than-expected third-quarter 2026 earnings. The all-stock merger created a defined takeout value for RRC shares, leading to an immediate surge in its stock price. This was further reinforced by robust operational performance, particularly record liquids production and an overall beat on revenue and earnings estimates, despite ongoing commodity price volatility.
Key Factors Contributing to Volatility:
- EQT Acquisition Announcement: On October 26, 2026, EQT Corporation announced an all-stock deal to acquire Range Resources, which propelled RRC's stock upwards due to the implied acquisition premium and potential synergies.
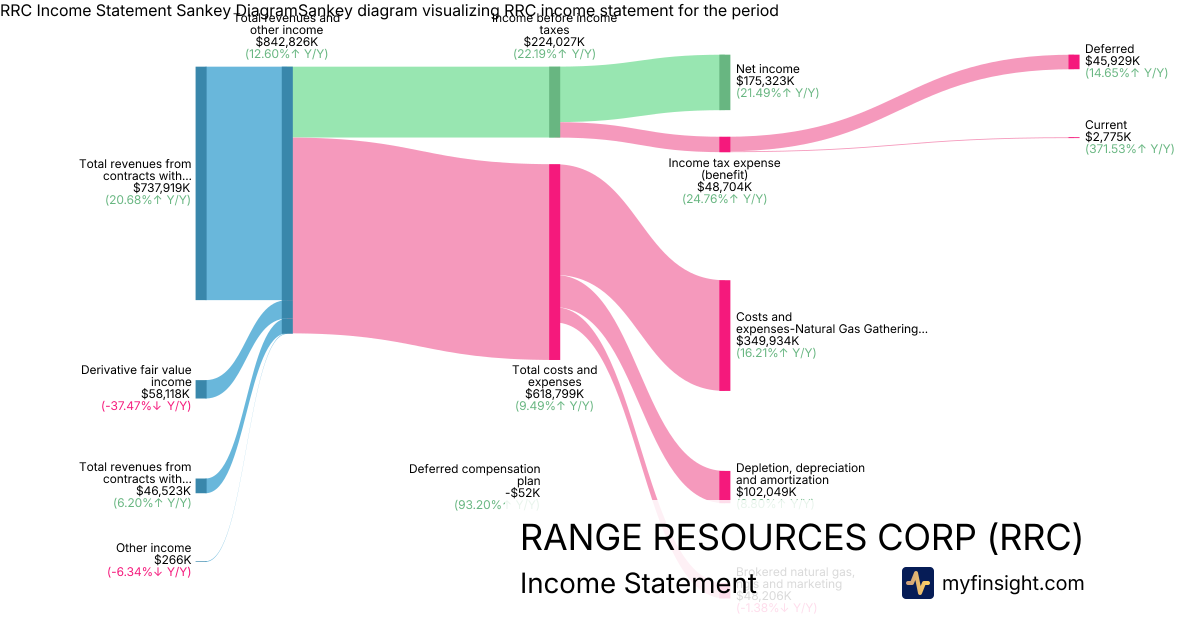
- Strong Q3 2026 Earnings: Range Resources reported a net income of $175 million ($0.75 per diluted share) for Q3 2026, surpassing analyst expectations.
- Record Liquids Production and Revenue Growth: The company achieved record liquids production of over 130,000 barrels per day, contributing to total revenues and other income of $843 million, exceeding market consensus.
- Derivative Gains: Q3 2026 results included a positive mark-to-market derivative gain of $58 million, influenced by decreases in commodity prices, which can add to earnings volatility.
- Analyst Sentiment and Merger Completion: While the acquisition provides a clear valuation, ongoing analyst caution, differing price targets, and the necessity for regulatory and shareholder approvals for the merger to close in Q1 2027 continue to influence market sentiment and stock fluctuations.
|
|
Revenue
$843M
|
|
Net Income
$175M
|
|
Net Margin
20.80%
|
|
🔍 Deep Dive: INNIO N.V.
Period Ending 2026-09-30
|
|
🚨 Price Alert: The stock price jumped by 6.06% around the earning call.
|
While INNIO (INIO) has recently experienced violent price fluctuations around its latest earnings call, the primary drivers appear to be a combination of exceptionally strong third-quarter financial results, particularly robust demand from the data center sector, and a substantial increase in its order backlog. The company's generally high stock volatility also contributes to dramatic price movements.
Key Factors Contributing to Volatility:
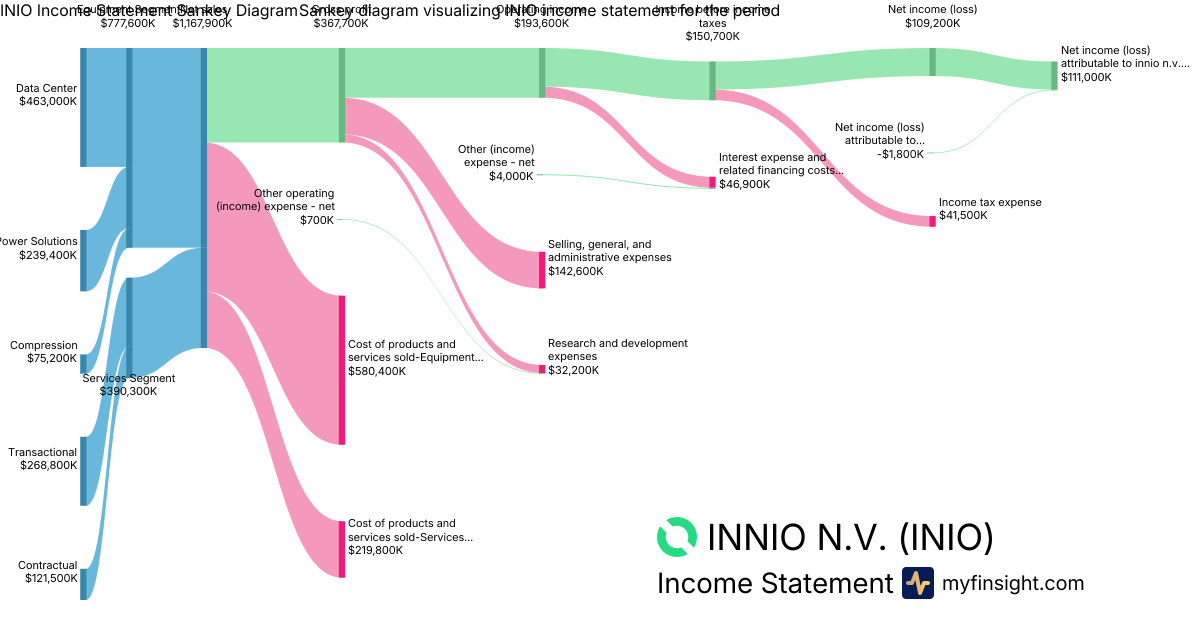
- Record Third-Quarter Performance: INNIO reported record quarterly net sales of $1.17 billion, marking a 57% year-over-year increase, and a significant rise in net income to $109 million, which was up 176% year-over-year. Adjusted EBITDA also surged by 70% to $245.4 million, with an expanded margin of 21%.
- Surging Data Center Demand: The company saw exceptional growth in its Equipment Segment, with revenue increasing 86% year-over-year to $778 million, largely driven by large-scale data center deliveries and strong compression demand. Data center orders accounted for 67% of equipment order intake.
- Record Equipment Order Backlog: INNIO's equipment order backlog reached a record $8.0 billion as of September 30, 2026, representing a 142% increase year-over-year, which provides substantial multi-year revenue visibility.
- Strong Services Segment Growth: The Services Segment continued to deliver strong performance, with revenue growing 20% to $390 million, supported by the company's expanding installed base.
- Raised Full-Year Guidance and Earnings Beat: Following the strong third-quarter results, INNIO raised its full-year 2026 revenue guidance to $3.9 - $4.0 billion and adjusted EBITDA guidance to $780 - $800 million. The company's reported diluted adjusted EPS of $0.15 also surpassed analyst consensus estimates of $0.11.
|
|
Revenue
$1.17B
|
|
Net Income
$111M
|
|
Net Margin
9.50%
|
|
🔍 Deep Dive: CENTERPOINT ENERGY INC
Period Ending 2026-09-30
|
|
🚨 Price Alert: The stock price jumped by 6.09% around the earning call.
|
CenterPoint Energy (CNP) has recently experienced significant price fluctuations around its Q3 2026 earnings call, driven by a combination of strong operational performance and an optimistic long-term growth outlook, alongside the strategic completion of a major divestiture and increased capital financing needs. The company's recent announcements have presented a mixed bag of positive developments and areas requiring substantial investment, leading to investor reactions.
Key Factors Contributing to Volatility:
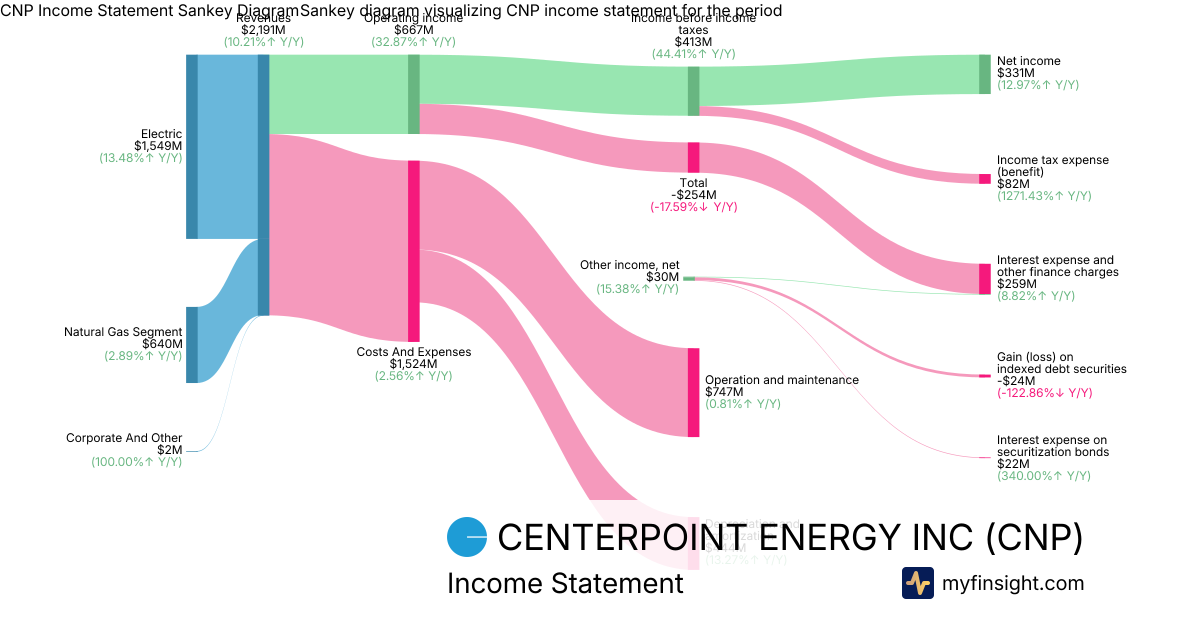
- Exceeded Earnings Expectations and Raised Guidance: CenterPoint Energy reported strong third-quarter 2026 GAAP net income of $331 million, or $0.50 per diluted share, with adjusted earnings of $0.53 per share, surpassing analyst estimates. The company also raised its full-year 2026 non-GAAP EPS guidance to $1.90-$1.92, signaling confidence in continued growth.
- Expanded Long-Term Capital Investment Plan: CenterPoint significantly increased its 10-year capital investment plan by $4 billion to $70.7 billion through 2035, accelerating $1.5 billion of projects into the first five years. This substantial investment, aimed at meeting accelerating customer demand, particularly in the Greater Houston area, is expected to drive a rate base compound annual growth rate (CAGR) of over 14% through 2030.
- Strategic Divestiture of Ohio Natural Gas Business: The recent completion of the $2.62 billion sale of its Ohio natural gas distribution business on October 1, 2026, represented a strategic move to optimize CenterPoint's portfolio and focus on its core utility operations. While intended to streamline operations and provide capital for reinvestment, the transition of $2.64 billion in current assets held for sale could have contributed to market adjustments as investors assessed the implications of the transaction and the use of proceeds.
- Higher Financing Costs and Potential Equity Dilution: Despite strong operational performance, higher financing expenses, including $259 million in interest and other finance charges, reduced earnings by $0.04 per share. To fund the expanded capital plan, CenterPoint increased its equity-financing outlook by $1.6 billion, planning to issue approximately $4 billion of equity from 2027 through 2030, which could lead to dilution for existing shareholders.
- Strong Operational Performance in Core Segments: The company's Q3 2026 results were positively impacted by growth and rate recovery, contributing $0.09 per share, and favorable weather conditions driving higher customer usage in its Texas and Indiana territories, adding $0.03 per share. CenterPoint reported total revenues of $2.19 billion and operating income of $667 million.
|
|
Revenue
$2.19B
|
|
Net Income
$331M
|
|
Net Margin
15.11%
|
|
🔍 Deep Dive: AMKOR TECHNOLOGY, INC.
Period Ending 2026-09-30
|
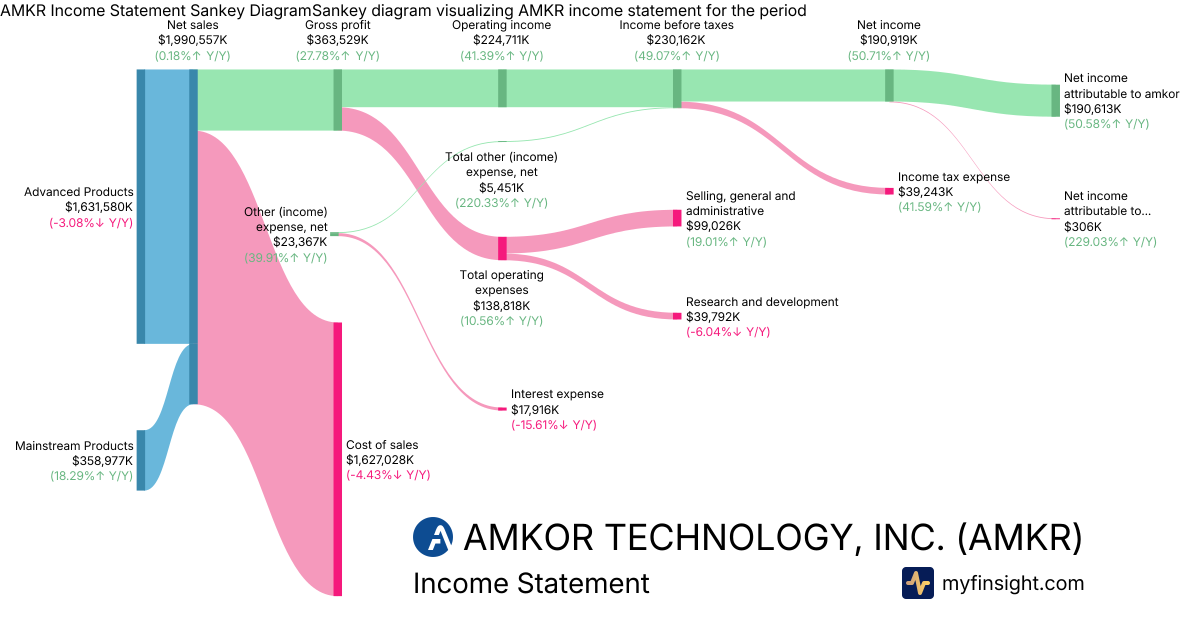
- Strong Q3 Performance and Margin Expansion: Amkor reported net sales of $1.99 billion for the third quarter of 2026, marking a 5% sequential increase. The company achieved a gross margin of 18.3% and an operating margin of 11.3%, driven by a richer mix of high-value advanced packaging products. Net income attributable to Amkor for the quarter was $191 million.
- Record Growth in Key Markets & Advanced Products: The Computing and Automotive & Industrial end markets delivered record revenue, with both segments growing 37% year-over-year. The Advanced Products segment generated $1.63 billion in revenue, highlighting its significant contribution to overall sales and margin expansion, while Mainstream Products contributed $359 million.
- Uneven Near-Term Growth Outlook: For the fourth quarter of 2026, Amkor forecasts continued growth in computing but anticipates declines in communications and consumer segments. This expected slowdown is attributed to memory and component shortages. Q4 revenue is projected to be between $1.9 billion and $2.0 billion, with net income ranging from $160 million to $185 million.
- Significant Capital Investments & Future Capacity: The company narrowed its estimated 2026 capital expenditures to approximately $2.5 billion, underscoring its commitment to expanding advanced packaging capacity in Arizona, Korea, and Vietnam to support long-term growth. Amkor reported capital expenditures payable of $496 million, with customer advance payments cited as a key funding source for these investments.
- Solid Financial Position: Amkor maintains a strong balance sheet, reporting cash and cash equivalents of $1.6 billion and long-term debt of $2.32 billion. This financial strength provides flexibility for ongoing strategic investments to fuel future growth.
Overall Takeaway
The Q3 2026 earnings call was broadly positive. Amkor demonstrated robust operational performance with strong revenue growth and significant margin expansion, particularly driven by its Computing and Automotive & Industrial markets and the Advanced Products segment. While the company narrowly missed analyst expectations for EPS and revenue, management emphasized strategic investments in advanced packaging capacity. However, the Q4 guidance points to uneven near-term growth due to anticipated declines in communications and consumer segments, introducing a cautious outlook for these areas.
|
|
Revenue
$1.99B
|
|
Net Income
$191M
|
|
Net Margin
9.58%
|
|
🔍 Deep Dive: CENTENE CORP
Period Ending 2026-09-30
|
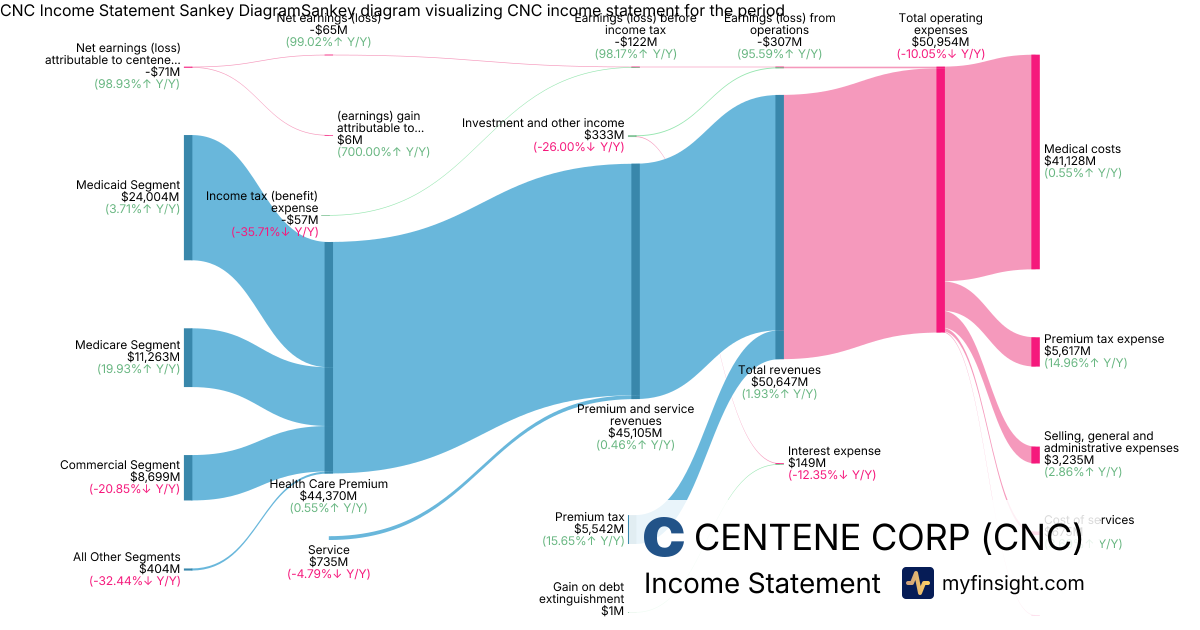
- Upgraded Full-Year Guidance and Exceeding Adjusted Earnings: Centene raised its full-year 2026 adjusted diluted EPS guidance to greater than $5.20 from over $4.80, demonstrating confidence in its financial outlook. Despite reporting a GAAP net loss attributable to the company of $-71 million for the quarter, adjusted diluted EPS of $0.58 exceeded expectations, with total revenues reaching $50.6 billion.
- Accelerated Medicare Advantage Turnaround and Strong Marketplace Performance: The company's Medicare Advantage business is now projected to achieve financial breakeven in 2026, a year ahead of its previous schedule, driven by favorable medical cost experience and disciplined management. The Marketplace segment also showed robust performance, with its full-year pretax margin expected at the top end of the 4.5% to 5.0% range.
- Medicaid Membership Dynamics and Strategic Responses: Centene is navigating a significant transition in its Medicaid segment, experiencing a 5.0% year-to-date decline in membership due to state eligibility redeterminations and the One Big Beautiful Bill Act (OB3). Management noted constructive rate adjustments from state partners to mitigate these impacts, with approximately 40% of Medicaid revenue scheduled to rerate at the beginning of 2027.
- Debt Reduction and Operational Efficiency Gains: Centene prioritized balance sheet strength by reducing total debt to $15.0 billion from $18.5 billion at the end of 2024, repurchasing an additional $1.1 billion in senior notes since Q2, including the full redemption of 2027 notes, which is expected to lower future interest expense. The adjusted selling, general, and administrative (SG&A) expense ratio improved to 6.5% in Q3, reflecting strong cost management and leveraging expenses over higher revenues.
- Mixed Cash Flow and Outlook for Future Growth: While Q3 saw a cash outflow from operations of $3.7 billion, primarily due to over $3 billion of anticipated Medicaid pass-through payments, year-to-date operating cash flow was positive at $4.3 billion. The company anticipates adjusted EPS growth in 2027, though persistent medical cost pressures and potential volatility in Medicaid remain key risks.
Overall Takeaway
The Q3 2026 earnings call for Centene was broadly positive. The company delivered strong adjusted earnings that surpassed expectations and raised its full-year adjusted EPS guidance, largely driven by accelerated profitability in Medicare Advantage and solid performance in the Marketplace segment. Despite managing a challenging transition in Medicaid membership, strategic debt reduction and improved operational efficiencies further contributed to a favorable outlook for investors.
|
|
Revenue
$50.6B
|
|
Net Income
-$71M
|
|
Net Margin
-0.14%
|
|
🔍 Deep Dive: Enphase Energy, Inc.
Period Ending 2026-09-30
|
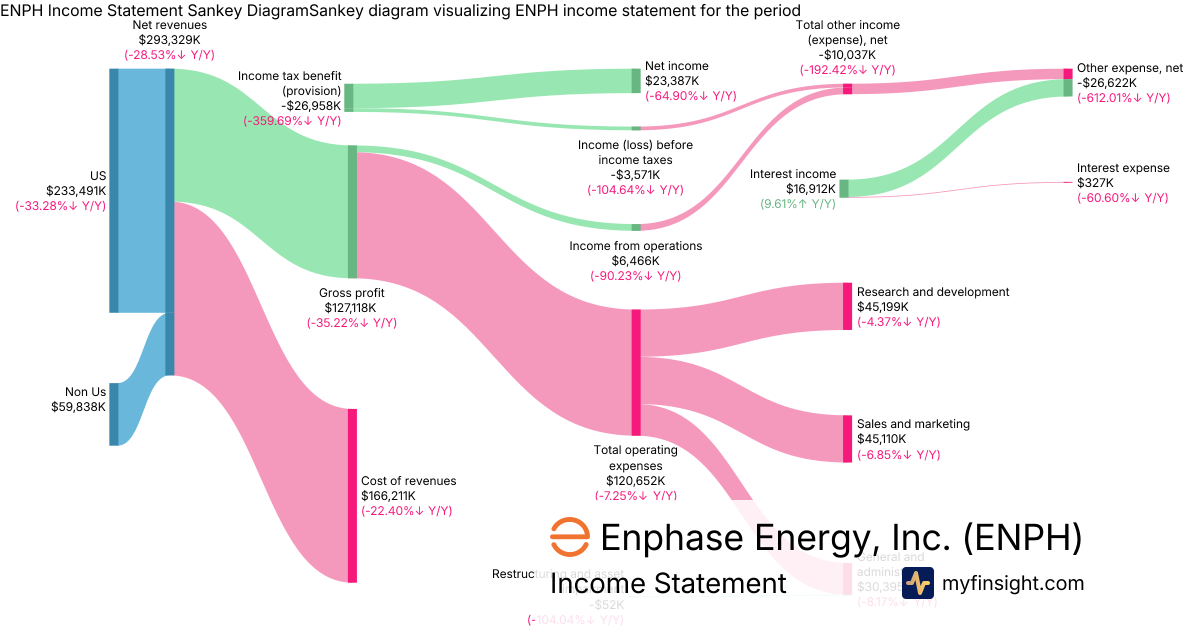
- Revenue Performance: Enphase Energy reported $293 million in net revenues. The majority of this revenue, $233 million, originated from the US market, with $59.8 million from international operations.
- Profitability Driven by Tax Benefit: The company achieved a positive net income of $23.4 million, despite reporting an operating income of $6.47 million and a pre-tax loss of -$3.57 million. This was primarily due to a significant income tax benefit of -$27 million.
- Impact of Advanced Manufacturing Production Tax Credit (AMPTC): The fair value of the Advanced Manufacturing Production Tax Credit generated amounted to -$58.6 million. This substantial credit likely played a critical role in enhancing the company's net profitability by offsetting costs or boosting income.
- Operating Expense Structure: Total operating expenses stood at $121 million. Key components included Research and Development at $45.2 million, Sales and Marketing at $45.1 million, and General and Administrative expenses at $30.4 million. The continued investment in R&D suggests an ongoing focus on product innovation.
- Solid Liquidity Position: Enphase Energy maintains a strong balance sheet with $380 million in cash and cash equivalents and $551 million in marketable securities. These contribute to total current assets of $1.88 billion, indicating robust financial flexibility.
Overall Takeaway
The recent earnings call for Enphase Energy was broadly neutral to cautiously positive. While the company reported positive net income and maintained a strong liquidity position, this profitability was largely bolstered by significant tax benefits and the Advanced Manufacturing Production Tax Credit, masking an underlying operational loss before taxes. Investors will likely be focused on the sustainability of these tax advantages and the company's ability to improve its core operating profitability in future periods.
|
|
Revenue
$293M
|
|
Net Income
$23.4M
|
|
Net Margin
7.97%
|
|
🔍 Deep Dive: Xylem Inc.
Period Ending 2026-09-30
|
|
🚨 Price Alert: The stock price dropped by 10.31% around the earning call.
|
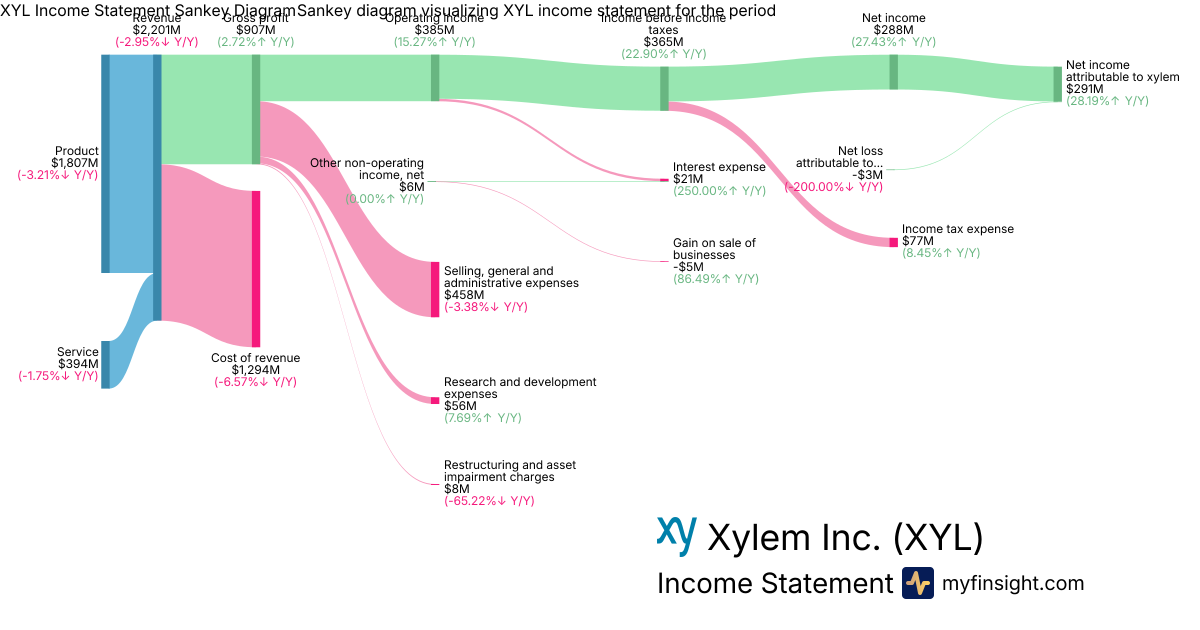
Xylem (XYL) recently experienced significant stock price volatility following its third-quarter 2026 earnings call on October 27, 2026. The primary drivers behind this fluctuation appear to be a combination of slightly missing earnings estimates and a notable revenue shortfall, coupled with a significantly lowered full-year profit outlook. This cautious outlook was largely attributed to delayed project timings and increased prudence in spending from municipal and industrial customers. Despite these headwinds, the company reported strong order growth and improved profitability.
Key Factors Contributing to Volatility:
- Earnings and Revenue Miss: Xylem reported third-quarter revenue of $2.2 billion, falling short of analyst expectations and marking a 3% year-over-year decline. Adjusted earnings per share of $1.44 also narrowly missed consensus estimates.
- Lowered Full-Year Guidance: The most impactful factor was the company's decision to cut its full-year 2026 revenue outlook to approximately $8.95 billion (from $9.2 billion previously) and adjusted EPS guidance to $5.40-$5.45 (from $5.55-$5.70), reflecting softer near-term expectations.
- Customer Caution and Project Delays: Management cited increased caution among municipal and industrial customers, leading to project timing delays and slower sales, particularly impacting the Measurement and Control Solutions segment.
- Strong Order Growth and Backlog: Counteracting the negative sentiment, Xylem reported healthy underlying demand with orders increasing 10% organically to $2.3 billion, contributing to an expanding backlog of $5.5 billion.
- Improved Profitability and Strategic Restructuring: The company achieved an improved adjusted EBITDA margin of 23.9% due to productivity and pricing. Xylem also announced plans for strategic portfolio restructuring and a reorganization into three segments starting in 2027 to enhance focus and profitability.
|
|
Revenue
$2.2B
|
|
Net Income
$291M
|
|
Net Margin
13.22%
|
|
🔍 Deep Dive: PENTAIR plc
Period Ending 2026-09-30
|
|
🚨 Price Alert: The stock price jumped by 18.09% around the earning call.
|
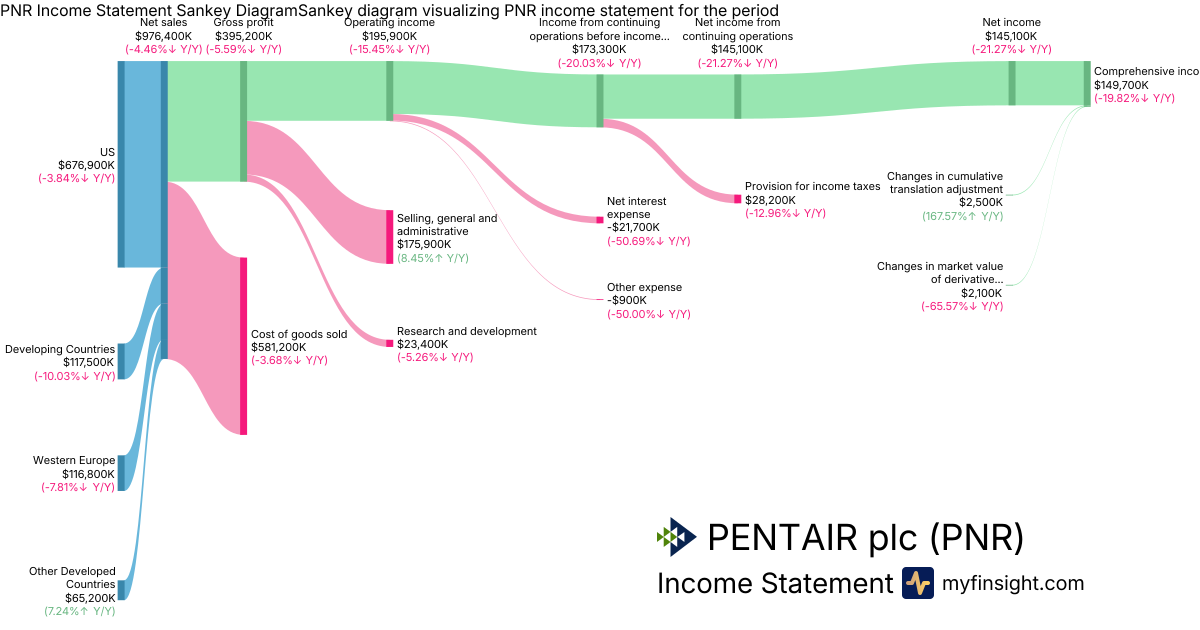
Pentair (PNR) recently experienced significant positive price fluctuations following its Q3 2026 earnings call, driven by better-than-expected financial results and a positive outlook for its key Pool business. The company reported adjusted earnings of $1.18 per share, surpassing analyst estimates, on strong revenues. Investors reacted favorably to signs of stabilization in its troubled swimming pool equipment business and strategic growth initiatives.
Key Factors Contributing to Volatility:
- Strong Q3 2026 Earnings Beat: Pentair reported third-quarter net sales of $976 million, exceeding analyst expectations. Adjusted earnings per share also topped forecasts, contributing to a surge in stock price. While net income was $145 million, the adjusted figures were a key highlight.
- Completion of Pool Channel Inventory Destock: A significant driver of investor optimism was the announcement that the channel inventory destocking in the Pool segment is complete. This process had previously weighed on results, and its conclusion positions the Pool business (Q3 sales of $292 million) for a healthier foundation and significant growth in 2027.
- Positive 2027 Outlook for Pool Segment: Management projected a strong rebound for the Pool segment in 2027, anticipating approximately 14% year-over-year sales growth and targeting around 30% return on sales, signaling confidence in future performance.
- Strategic Taco Group Holdings Acquisition: The recently completed acquisition of Taco Group Holdings is expected to be accretive to adjusted EPS in 2027 and adds a high-growth platform to Pentair's portfolio. The acquisition was financed with approximately $1.4 billion of debt, expanding Pentair's water management offerings.
- Reaffirmed Full-Year Guidance and Dividend Increase: Pentair reaffirmed its full-year 2026 adjusted EPS guidance, which was above the Wall Street consensus. Additionally, the company increased its dividend by 8%, marking its 50th consecutive year of dividend increases, underscoring its commitment to shareholder returns and perceived financial stability.
|
|
Revenue
$976M
|
|
Net Income
$150M
|
|
Net Margin
15.33%
|
|
🔍 Deep Dive: Hilton Worldwide Holdings Inc.
Period Ending 2026-09-30
|
- Mixed Q3 Financial Performance: Hilton reported total revenues of $3.33 billion in Q3 2026, marking a 6.6% year-over-year increase but falling short of analyst expectations. Despite this, the company exceeded adjusted EPS estimates, delivering $2.45 per share. Net income attributable to Hilton stockholders stood at $536 million, with operating income increasing 17% to $909 million.
- Strong Management & Franchise Growth and Development Pipeline: The asset-light Management and Franchise segment demonstrated robust performance with fees growing 9.5% year-over-year, contributing significantly to the approximately $1.01 billion generated by the segment. Hilton added 23,000 net rooms in Q3 and approved 30,500 new rooms for development, expanding its pipeline to 543,100 rooms.
- Optimistic Guidance Updates Driven by Business Travel: Management raised its full-year adjusted EPS guidance to $9.10 at the midpoint and increased full-year 2026 RevPAR growth guidance to 4%-4.5%. This positive outlook is primarily driven by strong business and group travel demand. However, the company projects slower Q4 RevPAR growth of 3%-3.5% due to calendar shifts and election-related effects, clarifying that underlying fundamentals remain strong.
- Significant Shareholder Returns and Strategic Listing Change: Hilton repurchased 2.6 million shares totaling $845 million during Q3, contributing to a year-to-date capital return of $2.902 billion through October, including dividends. The company aims to return approximately $3.5 billion to shareholders in 2026. Additionally, Hilton announced its stock listing will transfer to Nasdaq under the existing ticker "HLT" effective November 5, 2026.
- Regional Headwinds and Capital Structure Considerations: Despite overall growth, Hilton experienced RevPAR declines in certain regions, including a 5.6% fall in the Middle East and Africa (expected to be low double-digit decline for the full year) and a 5.4% decline in China. Investors should also note the company's capital structure, which includes $12.7 billion in long-term debt and a total Hilton stockholders' deficit of -$6.59 billion, a characteristic often associated with significant share repurchase programs.
Overall Takeaway
The Q3 2026 earnings call for Hilton (HLT) was **broadly positive**. The company demonstrated strong operational performance with healthy revenue growth, exceeding adjusted EPS estimates, and provided an optimistic outlook by raising its full-year RevPAR and EPS guidance, primarily driven by robust business and group travel demand. While challenges in specific international markets and a notable debt load warrant investor attention, Hilton's continued focus on its asset-light management and franchise model, coupled with significant capital returns to shareholders, indicates a confident and shareholder-friendly strategic direction.
|
|
Revenue
$3.33B
|
|
Net Income
$536M
|
|
Net Margin
16.12%
|
|
🔍 Deep Dive: CMS ENERGY CORP
Period Ending 2026-09-30
|
- Significant GAAP Net Loss Due to NorthStar Clean Energy Restructuring: CMS reported a GAAP net loss of $-91 million, with diluted GAAP EPS falling to $0.39, primarily driven by $454 million in impairment and restructuring charges related to the NorthStar Clean Energy segment. This contrasts with a rise in adjusted EPS to $1.44.
- Strategic Divestment and Reaffirmed Guidance: The company is on track to complete the NorthStar Clean Energy restructuring by year-end, expecting to generate over $500 million in funding benefits, and aiming for a 100% regulated utility model after 2027. Management reaffirmed 2026 adjusted EPS guidance of $3.83–$3.90 per share, trending toward the high end, and 2027 adjusted EPS guidance of $4.08–$4.17 per share, which incorporates the NorthStar restructuring.
- Robust Utility Segment Performance and Growth Investments: The core Electric Utility segment generated $1.77 billion in revenues, while the Gas Utility contributed $264 million. CMS also outlined a $27 billion Integrated Resource Plan (IRP) for clean energy, battery storage, and gas generation through 2040, supported by constructive regulatory outcomes and 2-3% annual load growth driven by new contracts.
- Stable Operating Revenue and Income Before Non-Operating Charges: Total operating revenue reached $2.18 billion, an 8.0% increase year-over-year. Despite this, operating income significantly declined to $47 million due to higher operating expenses.
- Substantial Debt and Financial Flexibility: The company maintains a significant long-term debt of $18.7 billion, with a current portion of $1.26 billion. The NorthStar restructuring is expected to enhance financial flexibility and reduce parent funding needs, supporting continued utility investments.
Overall Takeaway
The recent earnings call for CMS was broadly neutral to cautiously positive. While the reported GAAP net loss was significant due to impairment charges related to the NorthStar Clean Energy restructuring, adjusted earnings showed growth driven by solid performance in the core Electric and Gas Utility segments. Management's reaffirmation of future adjusted EPS guidance and the strategic shift towards a fully regulated utility model, coupled with substantial clean energy investment plans, provide a positive outlook on future earnings quality and stability, despite ongoing restructuring volatility and existing debt levels.
|
|
Revenue
$2.18B
|
|
Net Income
$121M
|
|
Net Margin
5.54%
|
|
🔍 Deep Dive: SHERWIN WILLIAMS CO
Period Ending 2026-09-30
|
- Mixed Financial Results with Revenue Beat: Sherwin-Williams reported robust net sales of $6.86 billion for the quarter, representing a high single-digit percentage increase year-over-year and surpassing revenue forecasts by 1.2%. However, adjusted diluted earnings per share (EPS) of $3.63, while up approximately 1% year-over-year, fell short of expectations by 1.6%. Net income for the period was $821 million.
- Gross Margin Pressures Amidst Growth Drivers: The company's gross margin faced notable pressure due to elevated raw material and supply chain costs, coupled with dilution from the recent Suvinil acquisition. Despite these headwinds, Sherwin-Williams delivered high single-digit sales growth, primarily driven by a favorable price mix, strategic acquisitions, and volume growth, successfully gaining market share across all three reportable segments.
- Strong Segment Performance and Volume Resilience: The Paint Stores Group remained the largest revenue contributor with sales reaching $4.02 billion. The Consumer Brands Group generated $2.49 billion, and the Performance Coatings Group contributed $1.92 billion in sales. Notably, the company achieved volume growth for the third consecutive quarter, demonstrating resilience despite continued softness and uneven demand in its end markets.
- Healthy Profitability and Balance Sheet: Adjusted EBITDA for the quarter rose 3.3% to $1.4 billion, maintaining an adjusted EBITDA margin of 20.5%, which is within the company's targeted range. The balance sheet remains strong, reflected by a net debt to adjusted EBITDA ratio of 2.4 times. Income before income taxes stood at $1.06 billion.
- Updated Guidance and Shareholder Returns: Management narrowed its full-year earnings guidance, indicating a cautious outlook. However, the company projects approximately $75 million in cost savings for 2027, including $25 million from restructuring actions announced in the second and third quarters of 2026. Sherwin-Williams also emphasized significant shareholder returns, with $749 million returned in the quarter and $3 billion year-to-date through share repurchases and dividends.
Overall Takeaway
The Q3 2026 earnings call for Sherwin-Williams was broadly neutral to slightly positive. While the company demonstrated strong top-line growth that exceeded market expectations and maintained healthy segment performance, the slight miss on adjusted EPS and continued gross margin pressures present areas of concern. Management's proactive approach to cost savings for 2027 and substantial shareholder returns, coupled with a solid balance sheet, offer positive signals for investors. However, the narrowed full-year guidance suggests a degree of near-term caution, balancing the overall sentiment.
|
|
Revenue
$6.86B
|
|
Net Income
$821M
|
|
Net Margin
11.97%
|
|
🔍 Deep Dive: WELLTOWER INC.
Period Ending 2026-09-30
|
- Mixed Financial Results with Revenue Beat: Welltower reported total revenues of $3.72 billion, which topped analysts' expectations. However, net income attributable to common stockholders was $397 million, resulting in earnings per share of $0.54, which fell short of the consensus forecast.
- Strong Operating Performance in Senior Housing: Normalized Funds From Operations (FFO) per diluted share increased 24.6% year-over-year to $1.67, surpassing analyst expectations. This was primarily driven by robust performance in the Seniors Housing Operating (SHO) portfolio, which saw a 21% year-over-year same-store Net Operating Income (NOI) growth, marking its 16th consecutive quarter of over 20% growth.
- Raised Full-Year Guidance: Management demonstrated confidence by raising the midpoint of its full-year 2026 normalized FFO guidance by $0.10 to $6.50 per share. The company also increased its full-year net income attributable to common stockholders per diluted share guidance range to $3.31 to $3.37.
- Active Capital Allocation and Portfolio Optimization: Welltower engaged in significant capital activity, completing $4.1 billion of pro rata gross investments in the quarter and $6 billion of dispositions in 2026, which included refining its medical office portfolio. The company also recorded a $115 million gain on real estate dispositions and acquisitions.
- Solid Liquidity and Maintained Dividend: The company reported a healthy cash and cash equivalents position of $2.27 billion and maintained its quarterly cash dividend of $0.85 per share. Net debt to adjusted EBITDA stood at 3.02 times at quarter-end.
Overall Takeaway
The recent earnings call for Welltower (WELL) was broadly positive from an operational standpoint, despite a mixed headline given the earnings per share miss. The company showcased strong performance within its core Senior Housing Operating segment, which continues to be a significant growth driver, and raised its full-year guidance for both FFO and net income. However, the market's initial negative reaction, with the stock falling 6.23%, suggests investors focused more on the earnings miss rather than the robust operating trends and increased outlook.
|
|
Revenue
$3.72B
|
|
Net Income
$397M
|
|
Net Margin
10.67%
|
|
🔍 Deep Dive: EXPAND ENERGY Corp
Period Ending 2026-09-30
|
- Solid Financial Performance: EXE reported a net income of $519 million on total revenues of $3.29 billion, demonstrating a robust top-line performance that translated into healthy earnings.
- Significant Derivative Gains: A substantial gain of $456 million from commodity contracts materially contributed to the income, indicating effective hedging strategies or favorable movements in commodity prices.
- Exploration and Production as Primary Revenue Driver: The Exploration and Production segment was the leading contributor to revenues, generating $2.35 billion, with natural gas sales being a significant component of its performance.
- Capital Intensive Operations: The Exploration and Production segment incurred $743 million in depreciation, depletion, and amortization, highlighting the considerable capital investments and asset base required for its core operational activities.
- Balance Sheet Strength and Liquidity: The company maintains a strong asset base of $29.7 billion, with a manageable long-term debt of $4.63 billion. Current assets are bolstered by $889 million in derivative assets, positively impacting short-term liquidity.
Overall Takeaway
The recent earnings call for EXE appears to be broadly positive. The company reported strong financial results, significantly supported by substantial gains from commodity derivatives. The Exploration and Production segment continues to drive revenue, underpinning the company's core operations. While these operations are capital intensive, EXE's balance sheet indicates a solid financial position with manageable debt and favorable short-term derivative asset holdings.
|
|
Revenue
$3.29B
|
|
Net Income
$519M
|
|
Net Margin
15.79%
|
|
🔍 Deep Dive: NXP Semiconductors N.V.
Period Ending 2026-09-27
|
|
🚨 Price Alert: The stock price jumped by 10.13% around the earning call.
|
NXP Semiconductors (NXPI) recently experienced significant price fluctuations around its latest earnings call, primarily driven by a mixed reaction to its strong third-quarter results and a slightly cautious outlook for the fourth quarter. While the company reported robust performance exceeding analyst expectations for Q3, its revenue guidance for Q4 fell marginally below consensus, leading to a notable sell-off in after-hours trading despite otherwise positive fundamentals.
Key Factors Contributing to Volatility:
- Strong Third-Quarter Performance: NXP reported total revenue of $3.79 billion, representing a 19% year-over-year increase, and adjusted earnings per share of $4.20, both surpassing Wall Street estimates. The company's net income was $899 million.
- Growth in Key Segments: Performance was bolstered by accelerating contributions from automotive (with revenue exceeding $2 billion for the first time), industrial & IoT (up 39%), and sustained momentum in data center infrastructure.
- Expanded Profitability and Cash Flow: NXP demonstrated strong operational leverage with a GAAP gross profit of $2.19 billion and an adjusted operating margin of 37.1%, along with significant free cash flow generation of $1.21 billion.
- New Share Repurchase Program: The board authorized an additional $5 billion for share repurchases, bringing the total authorization to approximately $6.3 billion, signaling confidence in the company's financial health and commitment to shareholder returns.
- Below-Consensus Q4 Revenue Guidance: Despite the strong Q3 results, the primary driver of the stock's after-hours decline was the fourth-quarter revenue guidance midpoint of $3.85 billion, which came in slightly below analysts' consensus estimates of around $3.86 billion to $3.87 billion.
|
|
Revenue
$3.79B
|
|
Net Income
$884M
|
|
Net Margin
23.35%
|
|
🔍 Deep Dive: ROYAL CARIBBEAN CRUISES LTD
Period Ending 2026-09-30
|
- Exceeded Earnings Expectations and Raised Full-Year Guidance: Royal Caribbean reported third-quarter adjusted earnings per share of $6.57, surpassing analysts' consensus estimates and exceeding the company's prior guidance. Consequently, management raised its full-year 2026 adjusted EPS guidance to a range of $17.85 to $17.95, representing 14% year-over-year growth.
- Strong Demand and Record Bookings: The company experienced stronger-than-anticipated close-in bookings, particularly for European and Caribbean itineraries, which contributed to outperforming net yield expectations. Booking volumes have increased in the mid-teens year-over-year, with 2027 sailings currently pacing ahead of historical levels at higher rates. Customer deposits reached an impressive $6.03 billion.
- Robust Revenue Growth and Operating Profitability: Total revenues for the quarter increased 8.8% year-over-year to $5.59 billion, meeting Wall Street's expectations. The company also achieved a healthy adjusted EBITDA of $2.5 billion with a 45% margin, and an operating margin of 33.5%.
- Strategic Investment in Sandals and Beaches Resorts: Royal Caribbean announced a planned $3 billion investment for a 50% stake in Sandals and Beaches Resorts, a deal expected to be immediately accretive to earnings and generate several hundred million dollars in synergy opportunities over time.
- Managing Costs and Capacity Expansion: Net cruise costs excluding fuel decreased by 1.8% year-over-year in constant currency, outperforming expectations. The company's capacity increased 8% year-over-year, delivering 2.7 million vacations during the quarter, with a load factor of 112%. Long-term debt remains a factor at $20.1 billion.
Overall Takeaway
The Q3 2026 earnings call for Royal Caribbean Cruises Ltd. was broadly positive. The company not only exceeded its own earnings guidance and raised its full-year outlook, but also demonstrated robust demand with strong booking volumes and record customer deposits. The strategic investment in Sandals and Beaches Resorts further highlights a growth-oriented approach, complementing solid operational efficiency and profitability.
|
|
Revenue
$5.59B
|
|
Net Income
$1.73B
|
|
Net Margin
30.91%
|
|
🔍 Deep Dive: IQVIA HOLDINGS INC.
Period Ending 2026-09-30
|
- Strong Q3 Financial Performance Exceeding Expectations: IQVIA reported robust third-quarter revenues of $4.43 billion, an 8% increase year-over-year, surpassing analyst estimates. GAAP net income attributable to IQVIA Holdings Inc. was $350 million.
- Accelerating Organic Growth and Robust R&D Bookings: The company experienced significant acceleration in organic revenue growth, more than doubling the prior year's pace. The Research and Development Solutions segment reported revenues of $2.64 billion, driven by a 15% jump in net new bookings, marking its strongest quarterly clinical bookings since 2022.
- Positive Full-Year 2026 Guidance Update: Management raised its full-year 2026 outlook for both revenue and adjusted EPS, reflecting improved operational performance and increased confidence in the company's trajectory.
- Profitability Expansion and Operational Efficiency: IQVIA achieved an 8.7% increase in adjusted EBITDA year-over-year, with adjusted EBITDA margin expanding by 20 basis points due to operational improvements. The company's income from operations stood at $572 million.
- Strategic Focus on AI and Favorable Market Conditions: The company emphasized its strategic commitment to artificial intelligence as a key competitive advantage and future growth driver. These strong results were further supported by a broad recovery in the life sciences outsourcing market.
Overall Takeaway
The Q3 2026 earnings call for IQVIA was broadly positive. The company delivered strong financial results that exceeded market expectations, driven by accelerating organic growth and record bookings in its Research and Development Solutions segment. Management's decision to raise full-year guidance, coupled with an emphasis on strategic initiatives like AI and favorable market trends in life sciences outsourcing, contributed to a confident outlook for investors.
|
|
Revenue
$4.43B
|
|
Net Income
$350M
|
|
Net Margin
7.90%
|
|
This newsletter is sent from
MyFinsight.com.
Was this email forwarded to you? Sign up here.
Unsubscribe
Copyright © 2026 MyFinsight, All rights reserved.
|