🚨 Robinhood Markets, Inc., 🔗 Avantor, Inc., 🔗 ServiceNow, Inc., 🔗 MICROSOFT CORP, 🚨 Vertiv Holdings Co

|

|
|
Daily Summary
|
October 28, 2026
|
Welcome to your daily digest. Today we are analyzing the latest income statements and filings from:
|
|
|
|
🔍 Deep Dive: Robinhood Markets, Inc.
Period Ending 2026-09-30
|
|
🚨 Price Alert: The stock price dropped by 6.90% around the earning call.
|
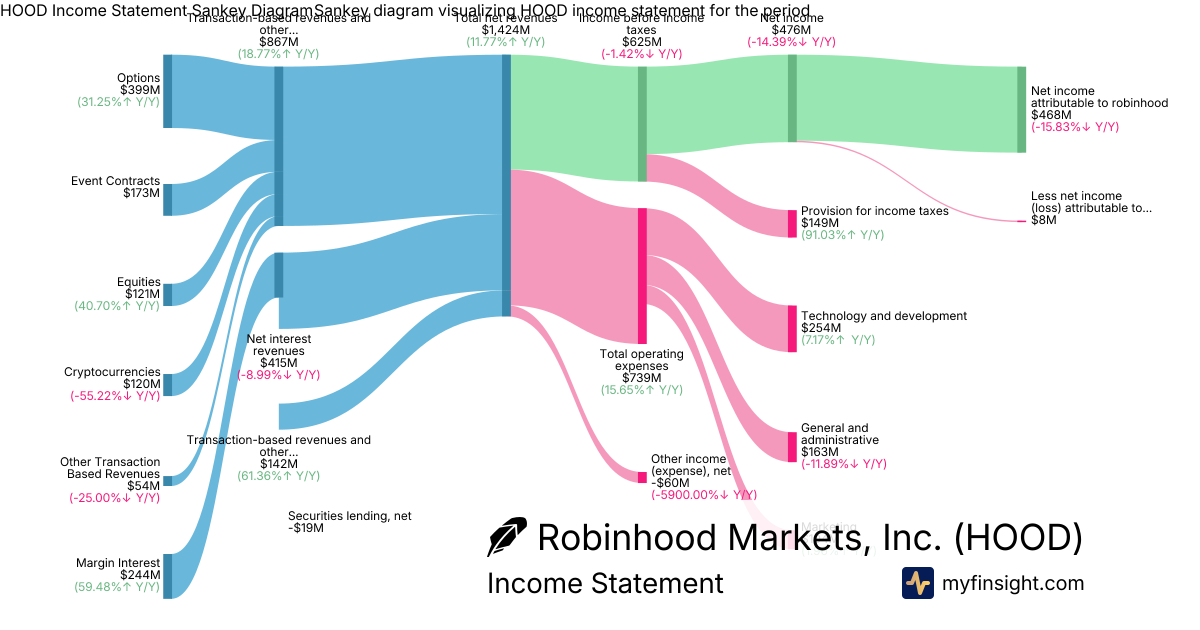
Robinhood (HOOD) experienced significant price fluctuations around its Q3 2026 earnings call due to a mixed financial performance, where record top-line revenue growth was offset by declining profitability, a sharp drop in cryptocurrency trading revenue, and increased operating expenses. The market's reaction highlighted investor sensitivity to key revenue streams and profit margins, despite overall growth in customer engagement and assets.
Key Factors Contributing to Volatility:
- Mixed Revenue Performance: Robinhood reported record total net revenues of $1.42 billion, marking a 12% year-over-year increase, yet this figure slightly missed Wall Street's expectations.
- Decline in Net Income: Despite revenue growth, GAAP net income decreased 14% year-over-year to $476 million, partly due to unrealized losses from investments.
- Sharp Drop in Cryptocurrency Revenue: Cryptocurrency revenue plunged 55% to $120 million, significantly impacting overall growth and reinforcing concerns about HOOD's sensitivity to digital asset market swings.
- Increased Operating Expenses: Total operating expenses rose 16% to $739 million, driven primarily by a substantial 173% surge in the provision for credit losses to $71 million.
- Strong Transactional & Subscriber Growth: Transaction-based revenues, excluding crypto, showed strength, rising 19% to $867 million due to record equity and options volumes, while Gold subscribers and funded customers also saw significant increases. This positive aspect was somewhat overshadowed by lower take rates and declining net interest revenue of $415 million.
|
|
Revenue
$1.42B
|
|
Net Income
$468M
|
|
Net Margin
32.87%
|
|
🔍 Deep Dive: Avantor, Inc.
Period Ending 2026-09-30
|
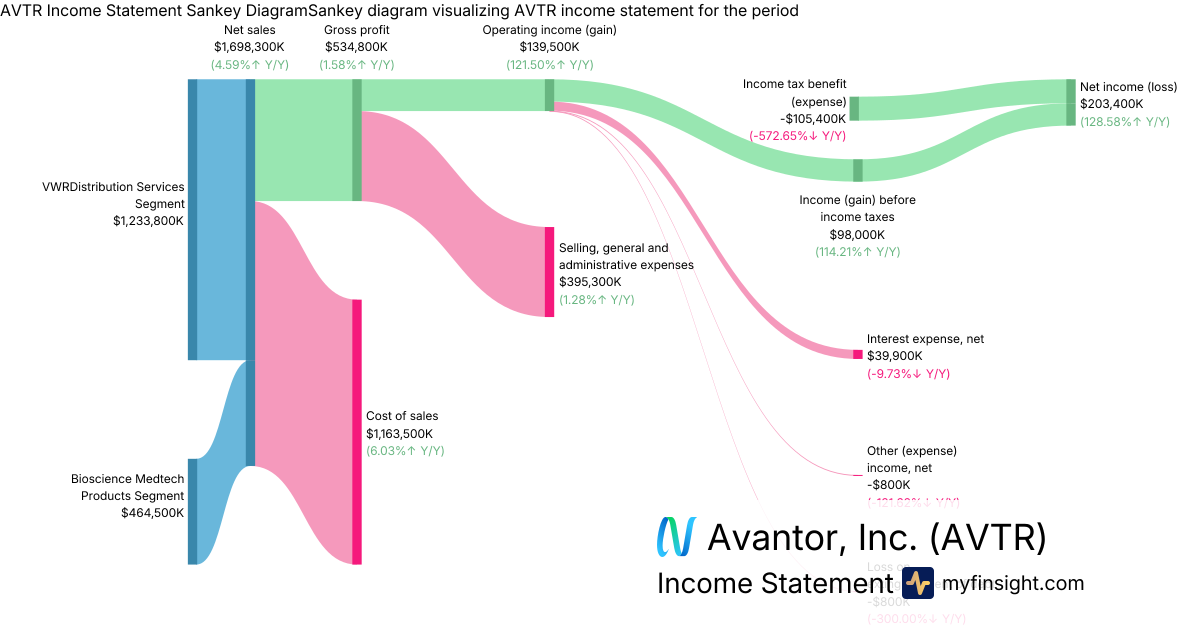
- Strong Revenue Performance and Organic Growth: Avantor reported net sales of $1.7 billion for Q3 2026, exceeding analyst consensus estimates of $1.64 billion and representing a 4.6% year-over-year increase, with organic growth at 5.2%. This marks a significant return to year-over-year growth. The VWR Distribution & Services segment delivered strong performance with $1.23 billion in revenue and 5.8% organic growth, while the Bioscience & Medtech Products segment also returned to growth with $464 million in revenue and 3.6% organic growth.
- Significant Profitability Turnaround: The company achieved a net income of $203 million, a substantial improvement from a $711.8 million net loss in the prior-year quarter, which was impacted by a large goodwill impairment charge. Adjusted EPS of $0.22 also beat analyst consensus estimates of $0.21. However, adjusted EBITDA declined 4.1% year-over-year to $257 million, reflecting ongoing margin pressures from mix effects and inflation, despite sequential improvement in the adjusted EBITDA margin.
- Raised Full-Year Guidance: Management demonstrated increased confidence by raising its full-year 2026 guidance across several key metrics. The outlook for organic revenue growth was raised to 0.75%-1.25% (up from -0.5% to +0.5%), adjusted EPS guidance was increased to a range of $0.81-$0.83, and free cash flow guidance was raised to $525 million-$550 million.
- Strengthened Balance Sheet and Improved Leverage: Avantor reduced its net debt by $173 million during the quarter, bringing its adjusted net leverage ratio down to 3.1x from 3.3x in the previous quarter. The company holds $464 million in cash and cash equivalents, with total long-term debt (net of current portion) at $3.65 billion. Management expects the adjusted net leverage ratio to fall below 3.0x by year-end.
- Revival Program Driving Performance: CEO Emmanuel Ligner highlighted the "Revival journey" as a key driver behind the improved execution and strengthening end markets, stating that the return to year-over-year growth is an "important milestone". The company's operational initiatives contributed to increased manufacturing throughput, particularly in the Bioscience & Medtech Products segment.
Overall Takeaway
The Q3 2026 earnings call for Avantor was broadly positive. The company exceeded analyst expectations on both revenue and adjusted EPS, marked a significant return to net income, and demonstrated robust organic growth across its key segments. Furthermore, management's decision to raise full-year guidance for several metrics, coupled with improvements in its balance sheet and leverage, indicates growing confidence in the company's strategic initiatives and future performance, despite facing ongoing margin pressures.
|
|
Revenue
$1.7B
|
|
Net Income
$203M
|
|
Net Margin
11.98%
|
|
🔍 Deep Dive: ServiceNow, Inc.
Period Ending 2026-09-30
|
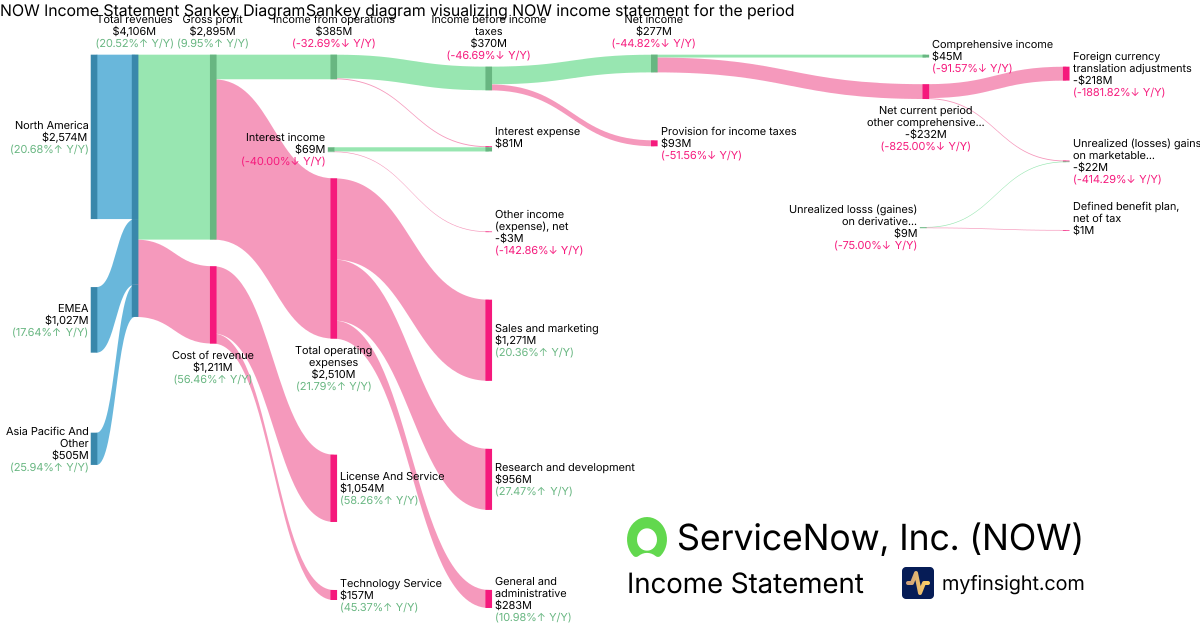
- Robust Revenue Growth: ServiceNow reported total revenues of $4.11 billion in Q3 2026, marking a 20.5% year-over-year increase and exceeding analyst estimates. Subscription revenues, a key driver, reached $3.99 billion, growing 21% year-over-year.
- Strong AI Momentum and Raised Guidance: The company saw accelerated AI adoption, with AI net new Annual Contract Value (ACV) exceeding expectations. Management raised its full-year AI net new ACV target to $1.7 billion for 2026, a 70% increase, demonstrating strong market traction for its AI offerings. Full-year subscription revenue guidance was also raised to $15.785 billion.
- Solid Profitability and Operating Efficiency: Despite missing adjusted EPS estimates, ServiceNow delivered a non-GAAP operating margin of 32.5%, which was 150 basis points above guidance. The company also raised its full-year free cash flow margin target to 36%. Net income for the quarter was $277 million.
- Future Revenue Visibility: Current remaining performance obligations (cRPO), representing future revenue to be recognized, grew 20.5% year-over-year to $13.65 billion, exceeding guidance and indicating a robust pipeline.
- Customer Expansion and Strategic Partnerships: ServiceNow reported 19 transactions over $5 million in net new ACV, representing over 135% year-over-year growth, and ended the quarter with 680 customers exceeding $5 million in ACV. The company also announced an expanded partnership with OpenAI to enhance AI for enterprise workflows.
Overall Takeaway
The Q3 2026 earnings call for ServiceNow was **broadly positive**. The company demonstrated strong revenue growth driven by its core subscription business and accelerating AI momentum, which led to raised full-year guidance for both subscription revenue and AI net new ACV. Although adjusted EPS slightly missed estimates, robust profitability metrics, including a higher-than-expected operating margin and an increased free cash flow margin outlook, alongside strong future revenue visibility from cRPO, paint a picture of solid operational performance and a promising outlook for continued growth.
|
|
Revenue
$4.11B
|
|
Net Income
$45M
|
|
Net Margin
1.10%
|
|
🔍 Deep Dive: MICROSOFT CORP
Period Ending 2026-09-30
|
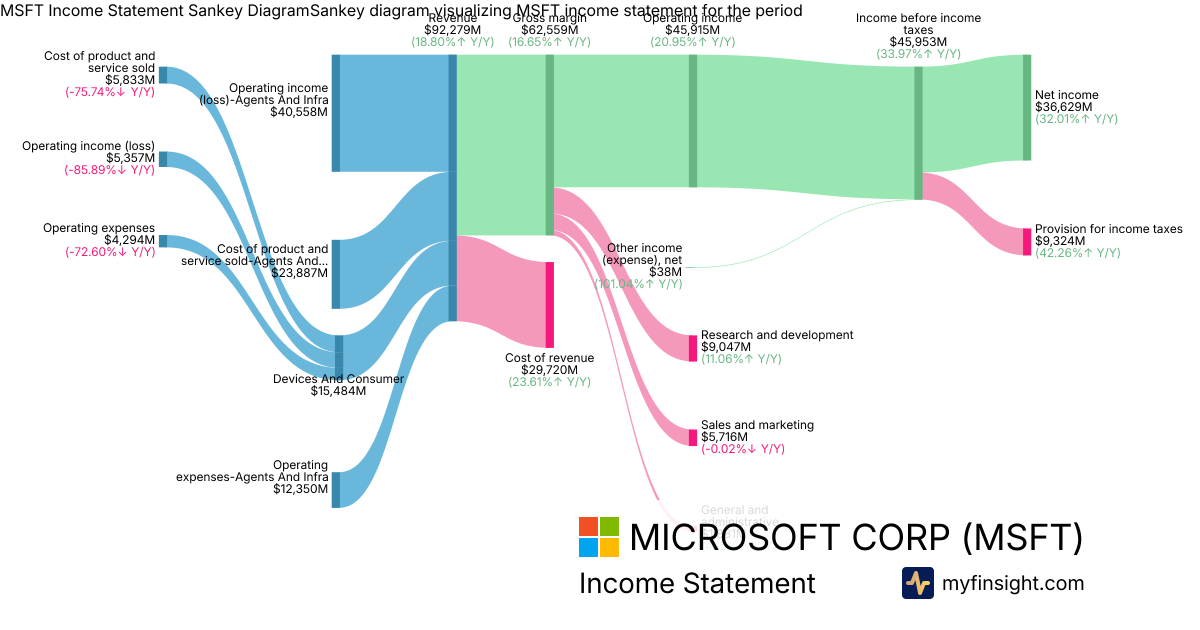
- Strong Overall Financial Performance: Microsoft reported robust total revenue of $92.3 billion, contributing to an impressive net income of $36.6 billion, demonstrating solid top-line growth and profitability.
- Continued Cloud Dominance: The company's cloud offerings remain a primary growth driver, with Azure generating $33.2 billion in revenue and Microsoft 365 Cloud adding $27.8 billion, highlighting sustained demand for its enterprise cloud solutions.
- Healthy Operating Margins: Microsoft showcased strong operational efficiency, achieving an operating income of $45.9 billion and a substantial gross margin of $62.6 billion.
- Significant Investment in Innovation: The company continues to prioritize future growth through substantial research and development, with $9.05 billion invested in R&D, likely fueling advancements in AI and other strategic technologies.
- Diversified Revenue Contributions: Beyond its core cloud services, Microsoft reported strong performances in other segments, including Search and Advertising revenue of $6.55 billion and XBOX revenue of $5.38 billion, indicating broad strength across its diverse business portfolio.
Overall Takeaway
The recent earnings call for Microsoft was broadly positive. The company demonstrated strong financial results across the board, driven primarily by robust growth in its Azure and Microsoft 365 cloud segments, which continue to be key revenue and profitability drivers. Significant investment in R&D further signals a commitment to innovation and future expansion.
|
|
Revenue
$92.3B
|
|
Net Income
$36.6B
|
|
Net Margin
39.69%
|
|
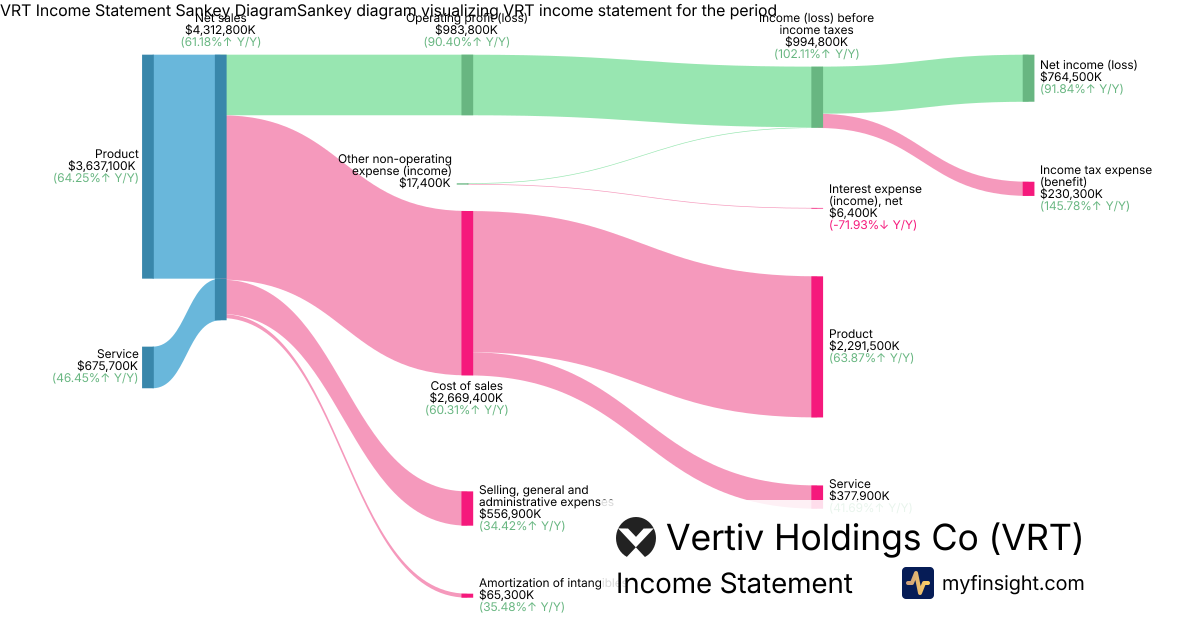
🔍 Deep Dive: Vertiv Holdings Co
Period Ending 2026-09-30
|
|
🚨 Price Alert: The stock price jumped by 19.35% around the earning call.
|
Vertiv Holdings Co (VRT) has recently experienced significant price fluctuations, primarily driven by its strong third-quarter 2026 earnings report, which substantially surpassed analyst expectations and led to a surge in its stock price. The company reported robust growth across key financial metrics, bolstered by increasing demand in critical digital infrastructure, particularly from the artificial intelligence (AI) data center sector.
Key Factors Contributing to Volatility:
- Exceptional Q3 2026 Performance: Vertiv reported net sales of $4.31 billion for Q3 2026, marking a 61% year-over-year increase and beating analyst estimates. This strong top-line growth, combined with a 91% surge in net income to $764 million, significantly exceeded market expectations.
- Robust Organic Growth and AI Demand: The company achieved 55% organic sales growth and saw organic orders more than double year-over-year, largely propelled by escalating demand for infrastructure solutions supporting AI data centers.
- Expanded Profitability: VRT demonstrated improved operational efficiency, with its adjusted operating margin expanding by 290 basis points to 25.2%. This contributed to a 90% increase in operating profit to $984 million.
- Upgraded Full-Year Guidance: Following the impressive Q3 results, Vertiv raised its full-year 2026 guidance across all key metrics, including sales, adjusted EPS, operating profit, and free cash flow, signaling continued confidence in future performance.
- Historical Volatility in Reporting: Historically, Vertiv's management has acknowledged the "lumpy nature of orders" and previously decided to cease reporting actual orders or backlog with quarterly earnings to mitigate excessive stock volatility that they believed was not representative of the company's sustained performance. This underlying sensitivity to reporting metrics likely contributes to pronounced price movements around earnings calls.
|
|
Revenue
$4.31B
|
|
Net Income
$764M
|
|
Net Margin
17.73%
|
|
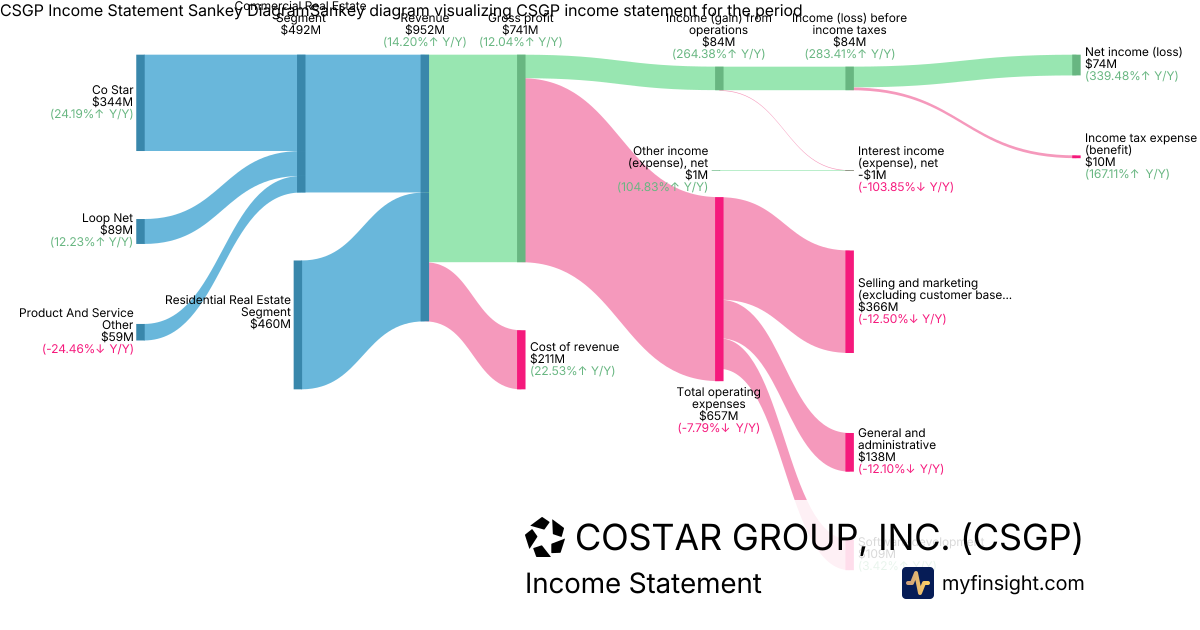
🔍 Deep Dive: COSTAR GROUP, INC.
Period Ending 2026-09-30
|
|
🚨 Price Alert: The stock price dropped by 16.67% around the earning call.
|
CoStar Group (CSGP) recently experienced significant price volatility around its Q3 2026 earnings call. While the company reported strong financial results that largely beat analyst expectations, including record revenue and profitability, the market's reaction was primarily driven by concerns over weaker-than-expected net new bookings and challenges related to its sales force capacity.
Key Factors Contributing to Volatility:
- Strong Top-Line Growth and Profitability: CoStar Group reported record Q3 2026 revenue of $952 million, a 14% increase year-over-year, marking its 62nd consecutive quarter of double-digit growth. Net income surged to $74 million, a significant improvement from a net loss in the prior year, and adjusted EBITDA doubled year-over-year to a record $229 million.
- Weak Net New Bookings and Sales Capacity Concerns: A primary driver of negative sentiment was the decline in annualized net new bookings to $37 million, down from $84 million in the prior year and below market expectations. Management attributed this to economic headwinds and insufficient sales capacity, including higher attrition within the inside sales team.
- Mixed Guidance Perception: Despite raising its full-year 2026 adjusted EBITDA guidance to $820-$840 million and reaffirming a $1.25 billion target for 2028, investors focused more on the bookings shortfall and potential slowdowns in organic growth rather than the increased profit outlook.
- Residential Segment Performance: The Residential Real Estate segment showed strong growth, with revenues climbing 23.3% year-over-year to $460 million, and adjusted EBITDA reaching $49 million, significantly improving profitability in this area.
- Broader Macroeconomic Headwinds: The broader market outlook for commercial real estate, characterized by rising interest rates and projected sharp drops in commercial property deliveries, contributed to investor caution regarding CSGP's future performance.
|
|
Revenue
$952M
|
|
Net Income
$74M
|
|
Net Margin
7.77%
|
|
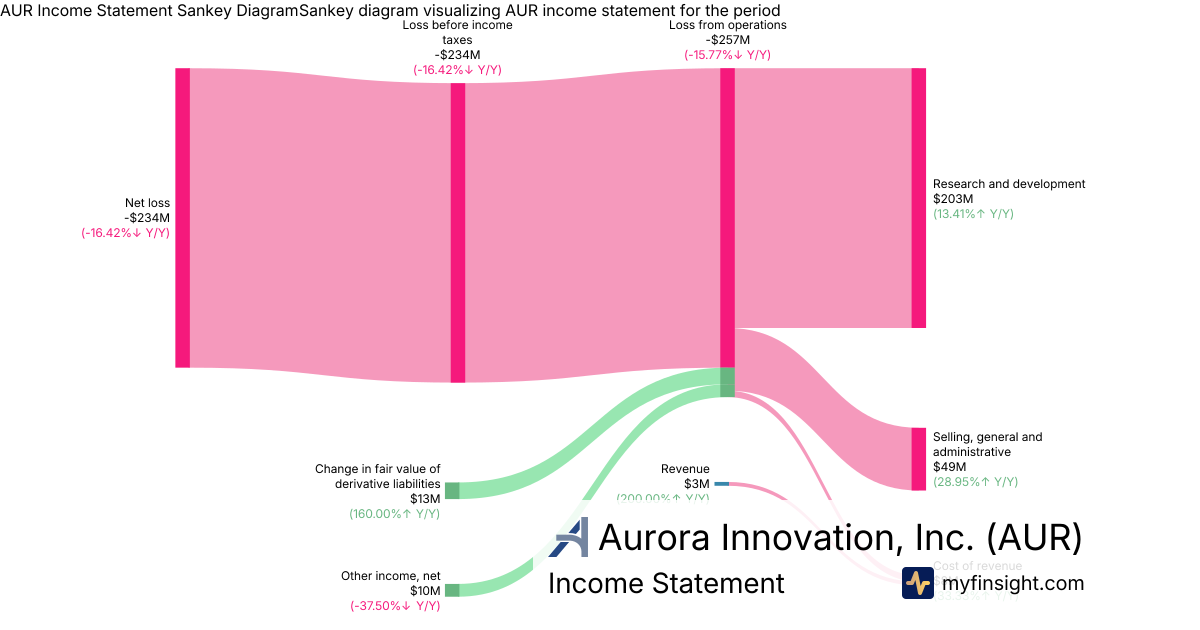
🔍 Deep Dive: Aurora Innovation, Inc.
Period Ending 2026-09-30
|
- Continued Significant Losses Amid Scaling Efforts: Aurora Innovation reported a net loss of -$234 million in Q3 2026, widening from -$201 million in the prior year, primarily due to substantial investments in research and development totaling $203 million. Despite minimal revenue of $3 million from driverless and supervised commercial loads, this signifies the initial stages of commercialization.
- Strong Liquidity and High Cash Burn Forecast: The company maintained a robust liquidity position, ending the quarter with over $141 million in cash and cash equivalents and $893 million in short-term investments, totaling over $1 billion. However, Q4 2026 cash burn is projected to increase to approximately $250 million, up from $170 million in Q3, mainly due to fleet production ramp-up.
- Production Delays and Revised Guidance: Management indicated that the production ramp for driverless trucks is approximately six weeks behind schedule. As a result, the full-year 2026 revenue outlook was revised downwards to approximately $9 million. Despite the delay, Aurora still expects to reach a production rate of 20 trucks per week by early December and aims to have more than 1,000 driverless trucks in operation by the end of 2027.
- Growing Customer Commitments and Regulatory Progress: Aurora announced a significant memorandum of understanding with Charger Logistics for 500 Driver as a Service (DaaS) trucks, with deliveries anticipated in 2027 and 2028. This adds to a growing customer base, with 10 driverless customers and over 20 driverless trucks already in the fleet. Additionally, a five-year federal exemption was granted for driverless trucks to use cab-mounted warning beacons, aiding the scaling of driverless freight.
- Long-Term Investment Phase Reflected in Accumulated Deficit: The substantial accumulated deficit of -$5.9 billion, alongside $7.7 billion in additional paid-in capital, highlights Aurora's sustained history as a company in a heavy investment and development phase, focusing on long-term technological advancement and fleet expansion rather than immediate profitability.
Overall Takeaway
The Q3 2026 earnings call for AUR was **neutral to slightly negative**. While the company demonstrated progress in commercialization with increasing revenue, customer commitments, and regulatory tailwinds, the significant net losses and a production ramp that is behind schedule tempered investor enthusiasm. The projected increase in cash burn for Q4 also raises concerns, though the company's strong existing liquidity provides a substantial runway for its continued development and fleet expansion efforts. Investors are likely to focus on the execution of production targets and a clearer path to profitability in future reports.
|
|
Revenue
$3M
|
|
Net Income
-$234M
|
|
Net Margin
-7800.00%
|
|
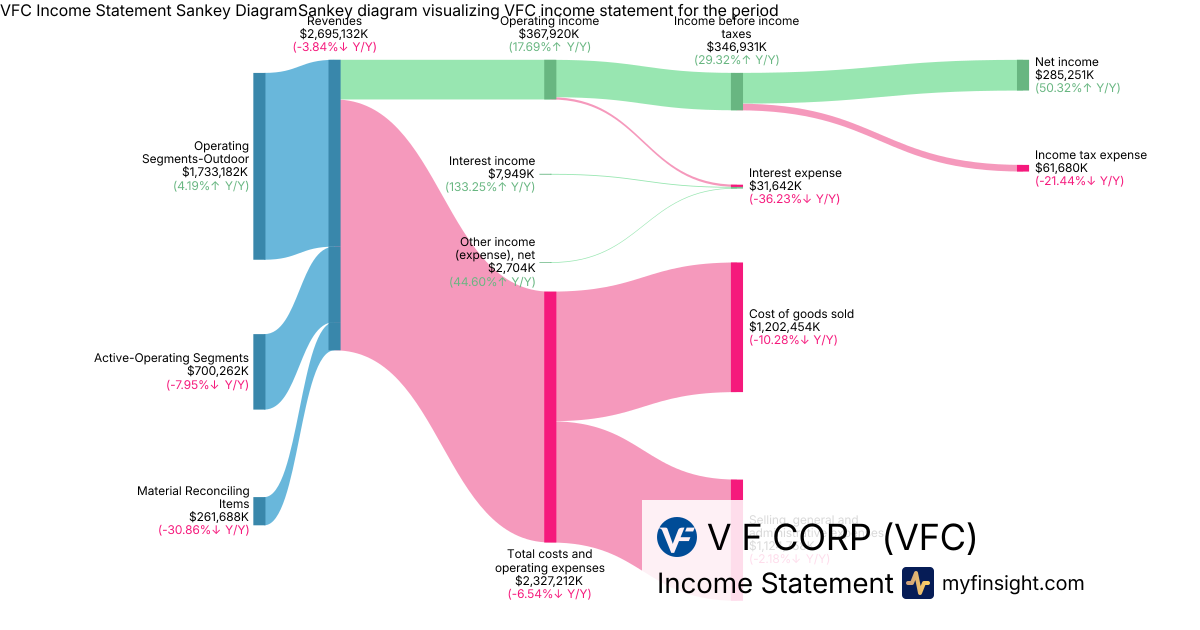
🔍 Deep Dive: V F CORP
Period Ending 2026-09-26
|
- Exceeding Expectations on Profitability: V.F. Corporation exceeded Q2 fiscal 2027 earnings per share expectations and reported total revenues of $2.7 billion. The company also delivered strong operating income of $368 million, notably above its guidance of approximately $315 million.
- Significant Margin Expansion: Gross margin expanded by 290 basis points to 55.4% year-over-year, primarily driven by lower product costs, price increases implemented in the prior year, and limited net tariff pressure. This margin expansion was a key factor in the reported 40% increase in EPS from a year earlier.
- Mixed Brand Performance with Key Growth: While Vans' revenue saw a decline of 9.8% in the quarter, its global Direct-to-Consumer (DTC) segment returned to growth for the first time in almost five years, with management anticipating wholesale improvement in the second half of fiscal 2027. Other key brands, including The North Face and Timberland, delivered consistent growth of 4% each, and Altra surged by over 40% across all regions and channels.
- Reaffirmed Full-Year Guidance and Debt Reduction: Management reaffirmed its full-year fiscal 2027 guidance, projecting revenue growth of 2% or better and an operating margin of approximately 8%. Furthermore, the company successfully reduced its net debt by $1.1 billion, representing a 20% decrease year-over-year.
- Inventory Investment for Future Demand: Net inventory increased by 7% year-over-year to $1.98 billion. This was described as a deliberate investment to support anticipated demand and sales initiatives in the upcoming second half of fiscal 2027.
Overall Takeaway
The Q2 fiscal 2027 earnings call for VFC was broadly positive. The company significantly surpassed its own guidance and analyst expectations for both profit and revenue, showcasing improved operational execution and substantial gross margin expansion. Despite ongoing challenges with Vans' overall revenue, the return to growth in its global DTC channel, coupled with strong performances from The North Face, Timberland, and Altra, indicates positive momentum in its turnaround strategy. The reaffirmation of full-year guidance and a notable reduction in net debt further instilled confidence in the company's financial trajectory.
|
|
Revenue
$2.7B
|
|
Net Income
$285M
|
|
Net Margin
10.58%
|
|
🔍 Deep Dive: Baker Hughes Co
Period Ending 2026-09-30
|
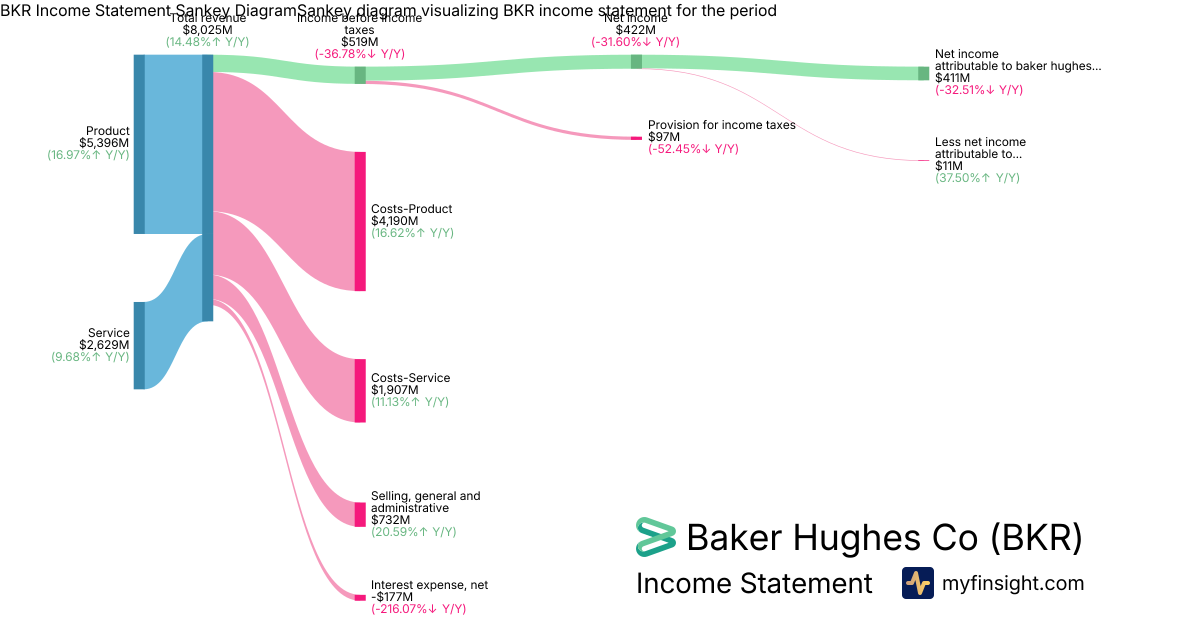
- Solid Revenue Performance: Baker Hughes reported total revenue of $8.03 billion, demonstrating strong top-line performance. Product revenue accounted for $5.4 billion, while service revenue contributed $2.63 billion.
- Increased Profitability: The company achieved a net income attributable to Baker Hughes Company of $411 million.
- Key Segment Contributions: The Industrial And Energy Technology segment generated $3.48 billion in revenue, while the Oilfield Services And Equipment segment contributed $3.66 billion, highlighting the primary drivers of the company's revenue.
- Healthy Cash Position: Baker Hughes maintained a strong liquidity position with $4.07 billion in cash and cash equivalents.
- Manageable Debt Profile: The company reported long-term debt of $17.5 billion, indicating its capital structure and financial leverage.
Overall Takeaway
The recent earnings report for Baker Hughes (BKR) was broadly positive, driven by robust total revenue and a healthy net income. The strong contributions from both the Industrial And Energy Technology and Oilfield Services And Equipment segments underscore diversified performance, while a solid cash position provides financial flexibility.
|
|
Revenue
$8.03B
|
|
Net Income
$411M
|
|
Net Margin
5.12%
|
|
🔍 Deep Dive: EQT Corp
Period Ending 2026-09-30
|
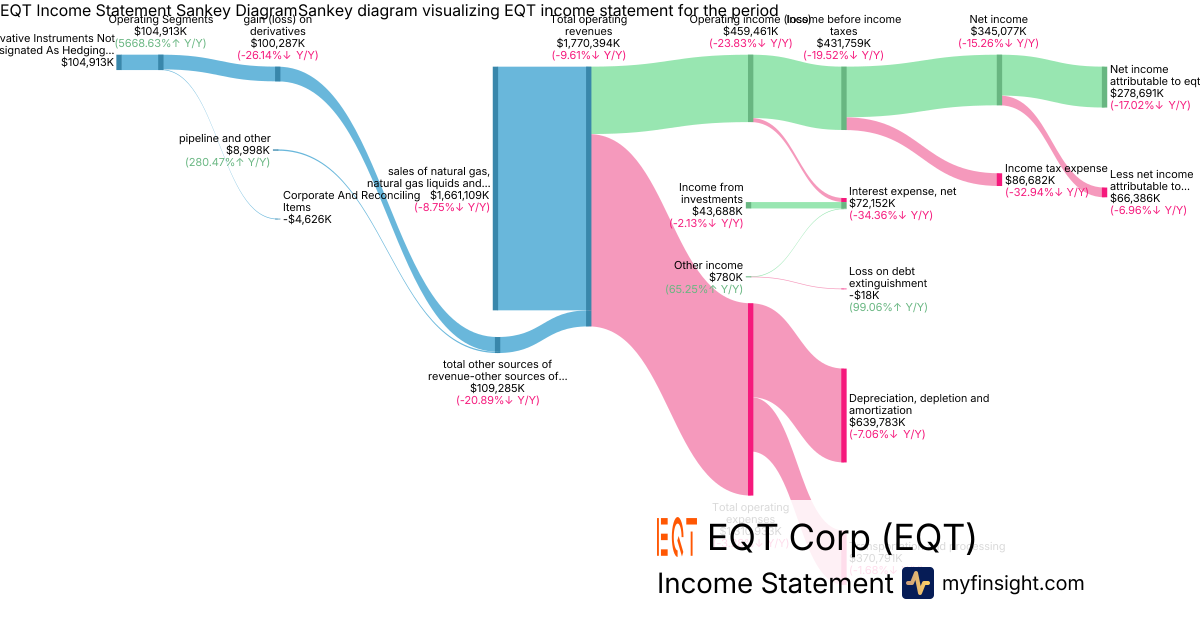
- Mixed Financial Performance with Revenue Beat: EQT reported Q3 2026 operating revenue of $1.77 billion, exceeding consensus estimates, though marking a 9.6% year-over-year decrease. The company's net income attributable to EQT Corporation was $279 million, a 17% decline, primarily influenced by lower production volumes and softer realized pricing.
- Strategic Acquisition of Range Resources: A significant development was the announced strategic acquisition of Range Resources Corporation, aimed at creating the largest vertically integrated natural gas producer. This move is expected to generate substantial annual synergies and reflects management's long-term bullish outlook on natural gas demand, driven by factors like AI data centers and LNG exports.
- Operational Efficiencies and Cost Management: EQT highlighted strong operational efficiencies and capital spending below guidance, which contributed to an adjusted EPS of $0.42, surpassing analyst forecasts despite downward pressure on natural gas prices. The company reported total operating expenses of $1.31 billion, including depreciation, depletion, and amortization of $640 million.
- Profitability and Balance Sheet Position: While the company reported an operating income of $459 million, free cash flow attributable to EQT experienced a decline. EQT's balance sheet reflects total assets of $41.4 billion and total liabilities of $12.4 billion, with significant debt reduction from year-end 2025.
- Guidance and Shareholder Returns: The company provided Q4 sales volume guidance of 550–600 Bcfe, including strategic curtailments. EQT also increased its dividend to $0.68 per share, demonstrating a commitment to shareholder returns.
Overall Takeaway
The Q3 2026 earnings call for EQT was broadly positive, despite a year-over-year decline in revenue and net income. The company surpassed analyst expectations on both EPS and revenue, demonstrating effective cost control and operational efficiencies in a challenging pricing environment. The announcement of the strategic acquisition of Range Resources, coupled with a significant reduction in net debt and a dividend increase, signaled management's confidence in long-term growth and shareholder value, although the short-term impact of lower production and soft pricing remains a factor.
|
|
Revenue
$1.77B
|
|
Net Income
$279M
|
|
Net Margin
15.74%
|
|
🔍 Deep Dive: CARVANA CO.
Period Ending 2026-09-30
|
- Record Revenue and Unit Sales: Carvana achieved a record $8.04 billion in revenue for Q3 2026, marking a 42% year-over-year increase and the first time surpassing the $8 billion quarterly threshold. Retail units sold also reached a company record of 217,385, up 39% from the prior year.
- Significant Profitability Milestones: The company reported a net income of $483 million, a substantial increase from the previous year. GAAP operating income hit a record $714 million, and adjusted EBITDA reached a new high of $800 million.
- Gross Profit and Margin Dynamics: Total gross profit increased 32% to $1.52 billion. However, the adjusted EBITDA margin decreased slightly to 10.0% from 11.3%, primarily due to a mix of higher-priced vehicles and customer incentives impacting gross profit per unit (GPU).
- Positive Outlook and Guidance Update: Carvana anticipates a sequential increase in retail units sold and adjusted EBITDA for the fourth quarter. Management also guided for full-year 2026 adjusted EBITDA to be at the higher end of its previous $2.7 billion to $3.0 billion range.
- Strategic Market Share Gains and Debt Impact: The company continued to gain market share in a flat used-car market, underscoring its long-term growth potential in a fragmented industry. Net income was impacted by a one-time $53 million pre-tax expense related to the early redemption of senior secured notes.
Overall Takeaway
The Q3 2026 earnings call for Carvana was broadly positive. Despite missing analyst EPS expectations and facing some pressure on gross profit per unit, the company delivered record revenue and significant improvements in profitability, including record net income, operating income, and adjusted EBITDA. The strong financial performance, coupled with positive forward guidance and continued market share expansion, indicates robust operational execution and a promising trajectory for the company.
|
|
Revenue
$8.04B
|
|
Net Income
$289M
|
|
Net Margin
3.59%
|
|
🔍 Deep Dive: COCA COLA CO
Period Ending 2026-10-02
|
- Strong Q3 Performance and Upgraded 2026 Outlook: Coca-Cola reported strong third-quarter results with comparable earnings per share of $0.91, an 11% increase year-over-year, and net operating revenues of $13.4 billion, up 7%. The company raised its full-year 2026 comparable EPS growth outlook to at least 11% and its free cash flow forecast to at least $13 billion. Organic revenue growth for 2026 is now expected to be at least 5%.
- Broad-Based Volume Growth and Market Share Gains: Global unit case volume grew 5%, driven by strong performance in key markets such as India, China, Mexico, and Brazil. The company also achieved its 22nd consecutive quarter of global value share gains in non-alcoholic ready-to-drink beverages, with Trademark Coca-Cola and Coca-Cola Zero Sugar volumes increasing significantly (16% for Zero Sugar).
- Margin Expansion and Strategic Execution: Comparable operating margin expanded to 32.9% from 31.9% in the prior year. Management emphasized the success of affordability initiatives, disciplined pricing strategies, and sustained investments, which contributed to organic revenue growth and improved profitability, despite some unfavorable mix impacts.
- Portfolio Optimization Through Divestitures: The anticipated refranchising of Coca-Cola Beverages Africa (CCBA) is expected to result in an approximate 8-point comparable revenue headwind and a 2-point comparable earnings per share headwind in 2027, but is projected to improve operating margins and the business's return profile. Coca-Cola is also exploring a potential initial public offering for its Indian bottling operations.
- Anticipated Q4 Headwinds and Currency Tailwinds: Management noted that fourth-quarter results would be impacted by six fewer days, slight concentrate destocking, and higher logistics and transportation expenses. Conversely, currency movements are expected to provide a 3-point earnings tailwind for the full year 2026.
Overall Takeaway
The Q3 fiscal 2026 earnings call for Coca-Cola was broadly positive. The company delivered strong financial results that exceeded expectations, demonstrated robust global volume growth across key markets and brands, and raised its full-year guidance for organic revenue, comparable EPS, and free cash flow. Despite acknowledging some short-term headwinds and divestiture impacts, management's commentary highlighted confidence in their strategic execution and continued market share gains, underpinning a favorable outlook for investors.
|
|
Revenue
$13.4B
|
|
Net Income
$4.01B
|
|
Net Margin
29.96%
|
|
🔍 Deep Dive: Mirion Technologies, Inc.
Period Ending 2026-09-30
|
|
🚨 Price Alert: The stock price jumped by 9.91% around the earning call.
|
Mirion Technologies, Inc. (MIR) has experienced significant stock price volatility around its recent Q3 2026 earnings call, driven by a mixed financial performance that showcased robust top-line growth and increased future outlook, yet presented concerns regarding profitability margins and adjusted earnings guidance.
Key Factors Contributing to Volatility:
- Strong Revenue Growth and Orders: MIR reported a 24.5% year-over-year increase in total revenues to $278 million, exceeding analyst estimates. This was coupled with a significant surge in core orders by 62%, and total orders by 85%.
- Accelerated Nuclear Power Demand: A primary driver of growth was a 105% increase in demand from nuclear power customers within the Nuclear Safety Segment, which generated $194 million in revenue, reflecting a global resurgence in nuclear energy.
- Raised Full-Year Guidance for Revenue and Free Cash Flow: The company increased its full-year 2026 revenue growth outlook to 24-25% and raised its adjusted free cash flow guidance, signaling confidence in continued top-line performance.
- Adjusted EBITDA Margin Contraction and Withdrawn Target: Despite revenue growth, adjusted EBITDA margins slightly contracted to 23.3% from 23.5% in the prior year, and the company lowered the high end of its adjusted EBITDA guidance for 2026 while withdrawing its previously announced 2028 margin target, citing factors like acquisition dilution and increased investments in AI and cybersecurity.
- Mixed Earnings Per Share Outlook: Adjusted earnings per share were reported at $0.12, matching analyst expectations. However, the full-year adjusted EPS guidance was slightly lowered, contributing to investor uncertainty. Net income attributable to Mirion Technologies, Inc. rose to $7.4 million in Q3 2026.
|
|
Revenue
$278M
|
|
Net Income
$7.4M
|
|
Net Margin
2.66%
|
|
🔍 Deep Dive: SLB LIMITED/NV
Period Ending 2026-09-30
|
|
🚨 Price Alert: The stock price jumped by 7.54% around the earning call.
|
SLB (SLB) recently experienced price fluctuations around its Q3 2026 earnings call, driven by a combination of strong operational performance, significant revenue growth, and a positive outlook, tempered by certain one-time charges impacting GAAP earnings. The company reported robust financial results that exceeded analyst expectations for both revenue and adjusted earnings per share.
Key Factors Contributing to Volatility:
- Exceeded Revenue and Adjusted EPS Expectations: SLB reported Q3 2026 total revenues of $9.45 billion, surpassing analyst estimates and marking a 5.8% year-on-year increase. The non-GAAP adjusted earnings per share of $0.64 also beat consensus estimates.
- Broad-Based Regional Growth: The company saw sequential revenue growth across all geographic regions, including a gradual recovery in the Middle East (with revenue of $2.81 billion reported for the Middle East segment) and strong performance in North America (generating $2.4 billion in revenue).
- Strong Digital and Data Center Solutions Performance: SLB's Digital segment reported Annualized Recurring Revenue (ARR) of $1.04 billion, a 13% year-on-year increase, and Data Center Solutions showed strong sequential growth, reinforcing the company's diversification beyond traditional oilfield services.
- Impact of Strategic Acquisitions and Positive Outlook: The ChampionX acquisition contributed significantly to revenue and improved profitability within Production Systems. Furthermore, management provided a "very compelling outlook for 2027" and projected Q4 revenue of approximately $10 billion, supported by increased backlog and visibility into the coming year.
- One-Time Charges Affecting GAAP EPS: Despite strong operational results, the GAAP diluted EPS of $0.49 was impacted by non-cash pension settlement charges of $187 million and merger and integration costs, which likely contributed to initial market reactions and volatility. The net income attributable to SLB was $735 million.
|
|
Revenue
$9.45B
|
|
Net Income
$735M
|
|
Net Margin
7.78%
|
|
🔍 Deep Dive: NOV Inc.
Period Ending 2026-09-30
|
- Revenue and Net Income Performance: NOV reported $2.23 billion in revenue, yielding a net income attributable to the company of $90 million.
- Operating Profitability: The company achieved a gross profit of $439 million, leading to an operating profit of $142 million, after significant selling, general and administrative expenses of $297 million.
- Strong Cash Position: NOV maintains a robust liquidity position with $1.06 billion in cash and cash equivalents.
- Healthy Balance Sheet: The company's total assets stand at $11.2 billion, supported by a healthy total stockholders' equity of $6.31 billion, with long-term debt reported at $1.69 billion.
- Cost Structure: The cost of revenue was a substantial $1.79 billion, indicating that a significant portion of revenue is attributed to direct costs of goods and services. The provision for income taxes was $28 million.
Overall Takeaway
The recent earnings call for NOV appears broadly neutral to positive. The company reported solid revenue and positive net income, indicating continued operational effectiveness. A strong cash position and a healthy balance sheet, evidenced by substantial total assets and stockholders' equity relative to long-term debt, suggest financial stability, though the high cost of revenue highlights the capital-intensive nature of its operations.
|
|
Revenue
$2.23B
|
|
Net Income
$90M
|
|
Net Margin
4.04%
|
|
🔍 Deep Dive: VICI PROPERTIES INC.
Period Ending 2026-09-30
|
- Strong Revenue Growth and Raised AFFO Guidance: VICI reported total revenues of $1.07 billion for Q3 2026, marking a 5.8% year-over-year increase and surpassing analyst consensus. The company also raised its full-year 2026 Adjusted Funds From Operations (AFFO) guidance to $2.47-$2.48 per diluted share.
- Significant Net Income Decrease Due to Non-Cash Charge: Net income attributable to common stockholders decreased by 55.1% year-over-year to $342.5 million, primarily driven by a substantial $458.0 million non-cash change in the allowance for credit losses (CECL charge). This charge was largely attributed to a higher long-term default estimate for Caesars after a rating agency downgrade.
- Continued Dividend Growth and Share Repurchase Program: VICI announced its 9th consecutive annual dividend increase, with a quarterly cash dividend of $0.46 per share, representing a 2.2% increase year-over-year. Additionally, the board authorized a new $2.0 billion share repurchase program, extending through September 30, 2029.
- Strategic Balance Sheet Management: The company successfully refinanced all remaining 2026 debt maturities by completing a $1.75 billion investment grade senior notes offering in August at an adjusted weighted average interest rate of 5.42%.
- Portfolio Expansion and Operational Efficiency: Management highlighted a 4.3% year-over-year increase in AFFO per share and the flow-through efficiency of its business model. The company also announced an agreement to add Highfield Investment Group to its tenant roster, with closing expected in Q4 2026 or Q1 2027.
Overall Takeaway
The Q3 2026 earnings call for VICI was broadly positive. Despite a significant non-cash credit loss allowance impacting reported net income, the company demonstrated strong revenue growth and delivered Adjusted Funds From Operations (AFFO) per share that was in line with consensus, while raising its full-year AFFO guidance. The commitment to shareholder returns was further evidenced by the ninth consecutive dividend increase and the authorization of a new share repurchase program, reinforcing management's confidence in future performance and operational efficiency.
|
|
Revenue
$1.07B
|
|
Net Income
$343M
|
|
Net Margin
32.15%
|
|
🔍 Deep Dive: GE HealthCare Technologies Inc.
Period Ending 2026-09-30
|
|
🚨 Price Alert: The stock price jumped by 7.96% around the earning call.
|
GE HealthCare Technologies (GEHC) recently experienced notable price movements around its Q3 2026 earnings call, primarily driven by a stronger-than-expected financial performance and an optimistic outlook. While earnings calls often lead to anticipatory fluctuations, GEHC's robust results and raised guidance significantly boosted investor confidence, leading to a sharp upward movement in the stock.
Key Factors Contributing to Recent Volatility and Positive Momentum:
- Exceeding Q3 2026 Earnings Expectations: GE HealthCare reported strong third-quarter 2026 results, with total revenues of $5.51 billion, exceeding market consensus. Net income attributable to GE HealthCare surged to $615 million, marking a 37.9% increase year-over-year.
- Raised Full-Year Guidance: The company raised its full-year 2026 guidance for key metrics, including organic revenue growth, adjusted EBIT margin, adjusted EPS, and free cash flow, signaling management's strong confidence in continued momentum.
- Broad-Based Segment Growth and Margin Expansion: Performance was strong across all segments, with notable growth in Advanced Imaging Solutions and Pharmaceutical Diagnostics. The company also achieved significant profitability expansion, with its adjusted EBIT margin reaching 16.6%, up 180 basis points.
- Strong Cash Flow Generation and Record Backlog: GEHC reported robust free cash flow of $793 million, an increase of $310 million versus the prior year, and a record backlog of $23.7 billion, underscoring durable demand for its healthcare equipment.
- Strategic Acquisition and Increased Shareholder Returns: The announcement of a planned $945 million acquisition of Sofie Biosciences to expand its radiopharmaceutical supply network, coupled with a 14% increase in its quarterly dividend, further enhanced investor sentiment.
|
|
Revenue
$5.51B
|
|
Net Income
$615M
|
|
Net Margin
11.16%
|
|
🔍 Deep Dive: Axogen, Inc.
Period Ending 2026-09-30
|
|
🚨 Price Alert: The stock price jumped by 36.16% around the earning call.
|
Axogen (AXGN) recently experienced significant price fluctuations, primarily driven by its strong third-quarter 2026 financial results, which surpassed analyst expectations, coupled with positive full-year guidance and strategic acquisition news. The stock notably surged over 23% in the 24 hours following the earnings announcement on October 28, 2026.
Key Factors Contributing to Volatility:
- Exceeding Earnings and Revenue Estimates: Axogen reported third-quarter revenue of $75.8 million, a 26.2% increase year-over-year, comfortably beating the consensus estimate of $73.2 million. Net income rose to $2.33 million, or $0.04 per diluted share, significantly up from $0.7 million in the prior year.
- Raised Full-Year Revenue Guidance: The company raised its full-year 2026 revenue guidance to at least $290 million, representing at least 29% growth, which was above prior expectations and contributed to investor optimism.
- Strategic Acquisition of BioCircuit Technologies: The completed acquisition of BioCircuit Technologies on October 1, 2026, bringing the FDA-cleared NerveTape device, was highlighted as a driver for future revenue and adjusted EBITDA, further fueling positive sentiment.
- Strong Cash Position and Commercial Payer Coverage: Axogen reported a significant increase in cash, cash equivalents, restricted cash, and investments to $329 million as of September 30, 2026, bolstered by a recent public offering. Additionally, expanded commercial payer coverage for its Avance Nerve Graft, now covering approximately 96% of lives in the U.S., supports continued market penetration.
- Gross Margin Decline Offset by Strong Growth: While gross margin slightly decreased to 74.8% from 76.6% year-over-year due to higher product costs, the overall strong revenue growth and positive outlook overshadowed this.
|
|
Revenue
$75.8M
|
|
Net Income
$2.33M
|
|
Net Margin
3.08%
|
|
🔍 Deep Dive: NISOURCE INC.
Period Ending 2026-09-30
|
- Strong Q3 Performance and Upgraded Outlook: NiSource reported GAAP net income available to common shareholders of $129.5 million for Q3 2026, translating to $0.27 diluted EPS, surpassing analyst estimates. The company narrowed its full-year 2026 adjusted EPS guidance to the upper half of the $2.02-$2.07 range and initiated robust 2027 adjusted EPS guidance of $2.22-$2.30, projecting double-digit growth.
- Ambitious Long-Term Capital Plan and EPS Growth Target: NiSource extended its long-term capital plan through 2033, committing to approximately $40 billion in investments, including $32 billion for base utility infrastructure and $8 billion for its GenCo segment. This plan underpins an increased consolidated adjusted EPS compound annual growth rate of 10%-11% from 2027 to 2033.
- GenCo Segment Driving Future Growth with Data Centers: The company highlighted the growing importance of its GenCo segment, securing a new 20-year electric service agreement with Microsoft, which adds 1,100 megawatts of capacity. This expanded portfolio is expected to contribute $1.75 billion in customer savings for NIPSCO electric customers and is projected to significantly boost future EPS.
- Solid Operational Performance and Revenue Growth: Q3 results were supported by $1.35 billion in operating revenues, disciplined cost management, and increased customer demand for natural gas and electricity across its operating companies. While operation and maintenance costs rose due to storm response, other O&M costs remained flat.
- Focus on Customer Affordability: Management emphasized efforts to manage customer bill impacts, with average annual residential bill increases anticipated to be less than 4% from 2027 through 2031, representing a reduction of over 100 basis points from its prior outlook.
Overall Takeaway
The Q3 2026 earnings call for NiSource (NI) was broadly positive. The company exceeded analyst expectations on earnings, raised and narrowed its 2026 guidance, and provided strong long-term EPS growth targets supported by a substantial capital investment plan. The strategic focus on the GenCo segment and securing large data center agreements, notably with Microsoft, positions NiSource for significant future growth, although managing customer affordability remains a key consideration.
|
|
Revenue
$1.3B
|
|
Net Income
$130M
|
|
Net Margin
9.97%
|
|
🔍 Deep Dive: Hayward Holdings, Inc.
Period Ending 2026-09-26
|
|
🚨 Price Alert: The stock price jumped by 22.43% around the earning call.
|
|
Revenue
$260M
|
|
Net Income
$32.4M
|
|
Net Margin
12.46%
|
|
🔍 Deep Dive: T-Mobile US, Inc.
Period Ending 2026-09-30
|
|
🚨 Price Alert: The stock price dropped by 6.13% around the earning call.
|
|
Revenue
$23.6B
|
|
Net Income
$3.5B
|
|
Net Margin
14.82%
|
|
🔍 Deep Dive: MGM Resorts International
Period Ending 2026-09-30
|
|
Revenue
$4.21B
|
|
Net Income
-$17.1M
|
|
Net Margin
-0.41%
|
|
🔍 Deep Dive: ETSY INC
Period Ending 2026-09-30
|
|
Revenue
$692M
|
|
Net Income
$854M
|
|
Net Margin
123.26%
|
|
🔍 Deep Dive: S&P Global Inc.
Period Ending 2026-09-30
|
|
Revenue
$3.68B
|
|
Net Income
$1.24B
|
|
Net Margin
33.71%
|
|
🔍 Deep Dive: CADENCE DESIGN SYSTEMS INC
Period Ending 2026-09-30
|
|
🚨 Price Alert: The stock price jumped by 7.06% around the earning call.
|
|
Revenue
$1.63B
|
|
Net Income
$290M
|
|
Net Margin
17.74%
|
|
🔍 Deep Dive: GE Vernova Inc.
Period Ending 2026-09-30
|
|
Revenue
$12.6B
|
|
Net Income
$1.29B
|
|
Net Margin
10.21%
|
|
🔍 Deep Dive: BIOGEN INC.
Period Ending 2026-09-30
|
|
Revenue
$2.8B
|
|
Net Income
-$20.6M
|
|
Net Margin
-0.73%
|
|
🔍 Deep Dive: GARMIN LTD
Period Ending 2026-09-26
|
|
🚨 Price Alert: The stock price dropped by 6.14% around the earning call.
|
|
Revenue
$1.99B
|
|
Net Income
$542M
|
|
Net Margin
27.27%
|
|
🔍 Deep Dive: Fortive Corp
Period Ending 2026-10-02
|
|
🚨 Price Alert: The stock price jumped by 9.85% around the earning call.
|
|
Revenue
$1.11B
|
|
Net Income
$172M
|
|
Net Margin
15.58%
|
|
🔍 Deep Dive: HUBBELL INC
Period Ending 2026-09-30
|
|
Revenue
$1.87B
|
|
Net Income
$262M
|
|
Net Margin
14.02%
|
|
🔍 Deep Dive: AMERICAN ELECTRIC POWER CO INC
Period Ending 2026-09-30
|
|
Revenue
$6.83B
|
|
Net Income
$1.19B
|
|
Net Margin
17.37%
|
|
🔍 Deep Dive: WASTE MANAGEMENT INC
Period Ending 2026-09-30
|
|
Revenue
$6.85B
|
|
Net Income
$820M
|
|
Net Margin
11.98%
|
|
🔍 Deep Dive: Phillips 66
Period Ending 2026-09-30
|
|
Revenue
$51.5B
|
|
Net Income
$5.62B
|
|
Net Margin
10.90%
|
|
🔍 Deep Dive: PPG INDUSTRIES INC
Period Ending 2026-09-30
|
|
🚨 Price Alert: The stock price jumped by 9.05% around the earning call.
|
|
Revenue
$4.35B
|
|
Net Income
$451M
|
|
Net Margin
10.36%
|
|
🔍 Deep Dive: Chubb Ltd
Period Ending 2026-09-30
|
|
Revenue
$16.2B
|
|
Net Income
$2.84B
|
|
Net Margin
17.56%
|
|
🔍 Deep Dive: LENNOX INTERNATIONAL INC
Period Ending 2026-09-30
|
|
🚨 Price Alert: The stock price dropped by 8.56% around the earning call.
|
|
Revenue
$1.57B
|
|
Net Income
$221M
|
|
Net Margin
14.07%
|
|
🔍 Deep Dive: PACCAR INC
Period Ending 2026-09-30
|
|
🚨 Price Alert: The stock price dropped by 6.95% around the earning call.
|
|
Revenue
$559M
|
|
Net Income
$848M
|
|
Net Margin
151.64%
|
|
🔍 Deep Dive: Aon plc
Period Ending 2026-09-30
|
|
🚨 Price Alert: The stock price jumped by 6.41% around the earning call.
|
|
Revenue
$4.1B
|
|
Net Income
$476M
|
|
Net Margin
11.61%
|
|
🔍 Deep Dive: ILLINOIS TOOL WORKS INC
Period Ending 2026-09-30
|
|
Revenue
$4.24B
|
|
Net Income
$855M
|
|
Net Margin
20.18%
|
|
🔍 Deep Dive: ESSEX PROPERTY TRUST, INC.
Period Ending 2026-09-30
|
|
Revenue
$493M
|
|
Net Income
$98.1M
|
|
Net Margin
19.90%
|
|
🔍 Deep Dive: Prologis, Inc.
Period Ending 2026-09-30
|
|
Revenue
$2.39B
|
|
Net Income
$816M
|
|
Net Margin
34.17%
|
|
🔍 Deep Dive: EQUINIX INC
Period Ending 2026-09-30
|
|
Revenue
$2.57B
|
|
Net Income
$489M
|
|
Net Margin
19.02%
|
|
🔍 Deep Dive: STATE STREET CORP
Period Ending 2026-09-30
|
|
Revenue
$4B
|
|
Net Income
$1.09B
|
|
Net Margin
27.22%
|
|
🔍 Deep Dive: Ventas, Inc.
Period Ending 2026-09-30
|
|
🚨 Price Alert: The stock price dropped by 6.27% around the earning call.
|
|
Revenue
$1.83B
|
|
Net Income
$65.4M
|
|
Net Margin
3.57%
|
|
🔍 Deep Dive: FEDEX CORP
Period Ending 2026-09-30
|
|
Revenue
$22.9B
|
|
Net Income
$290M
|
|
Net Margin
1.27%
|
|
🔍 Deep Dive: American Water Works Company, Inc.
Period Ending 2026-09-30
|
|
Revenue
$0
|
|
Net Income
$387M
|
|
Net Margin
-
|
|
🔍 Deep Dive: TYLER TECHNOLOGIES INC
Period Ending 2026-09-30
|
|
Revenue
$648M
|
|
Net Income
$95.1M
|
|
Net Margin
14.68%
|
|
🔍 Deep Dive: FIRSTENERGY CORP
Period Ending 2026-09-30
|
|
Revenue
$4.56B
|
|
Net Income
$557M
|
|
Net Margin
12.22%
|
|
🔍 Deep Dive: Honeywell Aerospace Inc.
Period Ending 2026-09-26
|
|
🚨 Price Alert: The stock price jumped by 10.71% around the earning call.
|
|
Revenue
$4.64B
|
|
Net Income
$726M
|
|
Net Margin
15.63%
|
|
This newsletter is sent from
MyFinsight.com.
Was this email forwarded to you? Sign up here.
Unsubscribe
Copyright © 2026 MyFinsight, All rights reserved.
|