🚨 Alphabet Inc., 🚨 Norwegian Cruise Line Holdings Ltd., 🔗 FORD MOTOR CO, 🚨 PINTEREST, INC., 🚨 CHIPOTLE MEXICAN GRILL INC

|

|
|
Daily Summary
|
October 29, 2026
|
Welcome to your daily digest. Today we are analyzing the latest income statements and filings from:
|
|
|
|
🔍 Deep Dive: Alphabet Inc.
Period Ending 2026-09-30
|
|
🚨 Price Alert: The stock price dropped by 15.22% around the earning call.
|
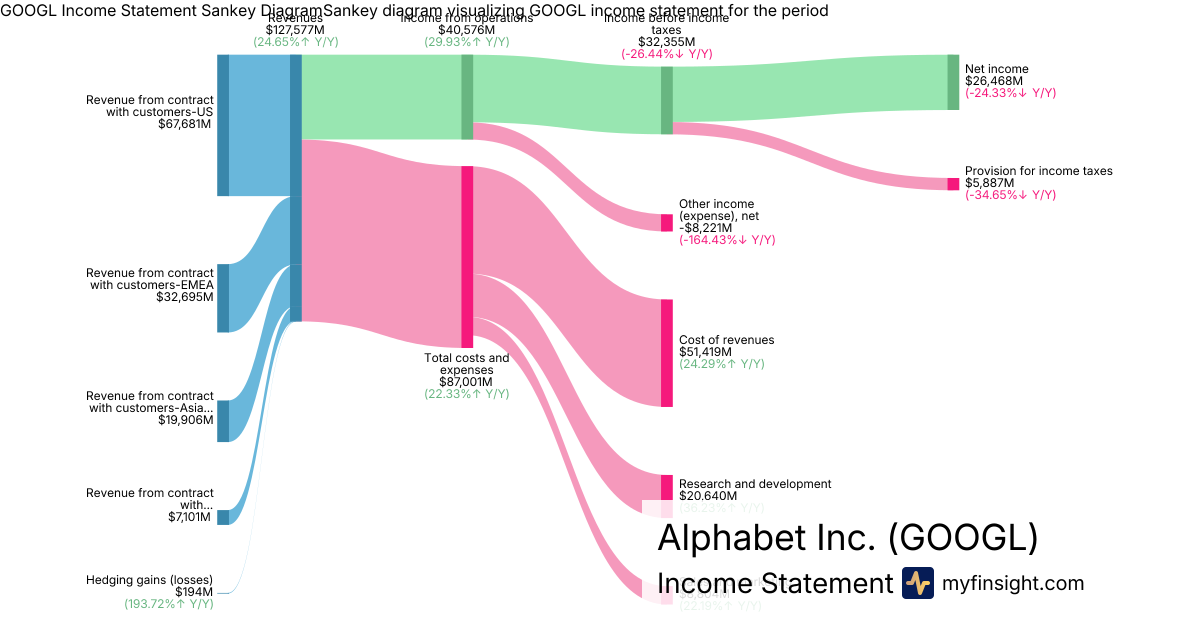
Alphabet (GOOGL) recently experienced significant stock price fluctuations following its Q3 2026 earnings call, primarily driven by a substantial earnings per share (EPS) miss and concerns over escalating capital expenditures, despite robust revenue and exceptional Google Cloud growth. The stock saw a decline of approximately 7% to 12% in after-hours and subsequent trading.
Key Factors Contributing to Volatility:
- Significant EPS Miss Driven by Investment Losses: Alphabet reported diluted EPS of $2.12, falling short of analyst expectations. This miss was largely attributed to an unrealized loss of $8.66 billion on equity securities, notably its investment in SpaceX.
- Soaring Capital Expenditures and Negative Free Cash Flow: The company reported substantial capital expenditures of $51.4 billion for the quarter, primarily allocated to AI infrastructure. This heavy investment resulted in a negative free cash flow of $9.07 billion, significantly worse than analysts anticipated, raising investor concerns about near-term cash generation and profitability.
- Decelerating Search Advertising Growth: While Google Search & other advertising revenue still grew by 12% to $63.35 billion, this represented a slowdown compared to previous quarters and missed Wall Street estimates. Some reports suggest that lower monetization from AI Mode features contributed to this deceleration.
- Robust Google Cloud Performance: Google Cloud continued its strong performance, with revenue surging 103% to $30.7 billion and operating income more than tripling. However, this impressive growth was largely overshadowed by other financial concerns.
- Overall Revenue Beat Overshadowed by Profit Miss: Alphabet's total revenues increased by 25% year-over-year to $128 billion, slightly exceeding some analyst forecasts. However, this top-line beat was overshadowed by the significant profit shortfall.
|
|
Revenue
$128B
|
|
Net Income
$26.5B
|
|
Net Margin
20.75%
|
|
🔍 Deep Dive: Norwegian Cruise Line Holdings Ltd.
Period Ending 2026-09-30
|
|
🚨 Price Alert: The stock price jumped by 16.87% around the earning call.
|
Norwegian Cruise Line Holdings (NCLH) experienced significant price fluctuations around its recent Q3 2026 earnings call, primarily driven by a robust earnings beat and an upward revision of its full-year guidance, which initially propelled the stock higher. However, underlying factors such as flat year-over-year revenue, some operational metric declines, and a substantial debt load likely contributed to the "violent" nature of the fluctuations, as investors weighed strong headline numbers against ongoing challenges.
Key Factors Contributing to Volatility:
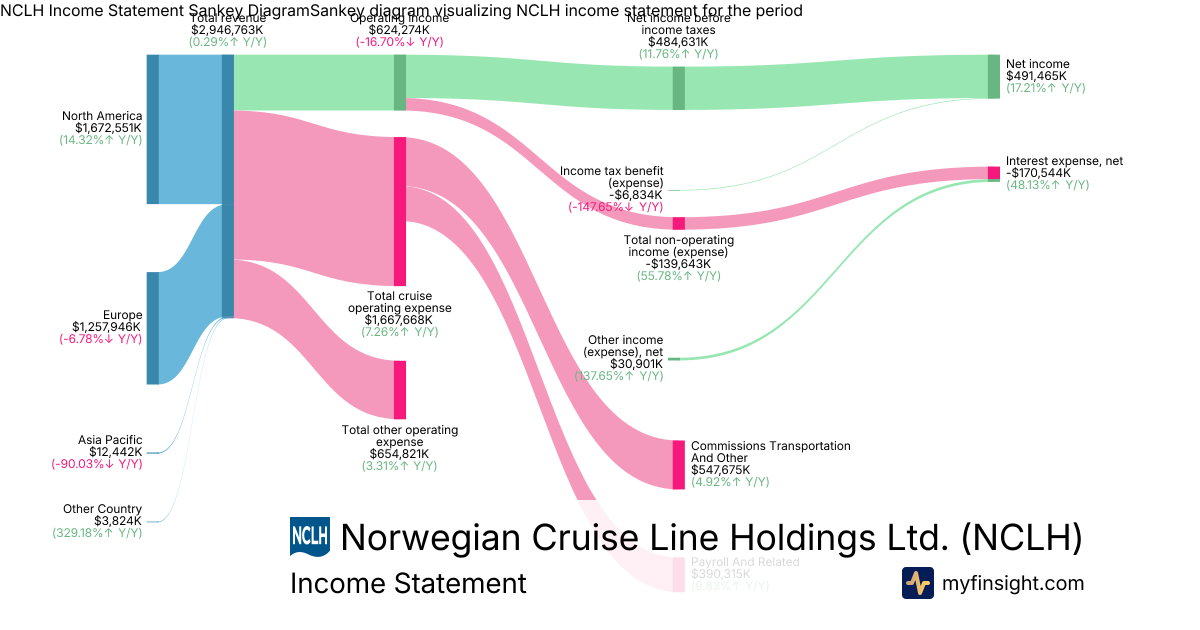
- Strong Q3 Earnings Beat and Raised Guidance: NCLH reported Q3 2026 total revenue of $2.95 billion, surpassing analyst estimates, and a GAAP net income of $491 million, significantly beating consensus EPS projections. The company also raised its full-year 2026 adjusted EBITDA and adjusted EPS guidance, leading to an immediate stock surge of over 10%.
- Mixed Operational Metrics: Despite the revenue beat, Q3 revenue was flat year-over-year. Operating income declined to $624 million, and Net Yield decreased by 6.5% (6.7% on a constant currency basis) compared to the prior year, though this was better than the company's own guidance.
- Persistent High Debt and Liquidity Management: The company continues to carry a substantial debt burden, with long-term debt at $14 billion and total liabilities at $20.9 billion. NCLH recently completed a $950 million senior notes issuance and upsized its revolving loan facility to enhance its liquidity position and manage its maturity profile.
- Booking Trends and Future Demand Outlook: While the company reported improved close-in bookings and passenger spending, its forward booked position, although better, remains below the "optimal range". Management projects net yield growth of 1% to 2% in 2027, with acceleration in the second half.
- Cost Discipline and Strategic Turnaround: NCLH highlighted efforts in cost control, with adjusted net cruise cost excluding fuel decreasing by 2.3%, exceeding guidance. The company also identified additional run-rate savings of approximately $100 million and announced a new CFO to take office in January 2027, reinforcing its multi-year turnaround strategy.
|
|
Revenue
$2.95B
|
|
Net Income
$491M
|
|
Net Margin
16.68%
|
|
🔍 Deep Dive: FORD MOTOR CO
Period Ending 2026-09-30
|
- Raised Full-Year Adjusted EBIT Guidance: Ford increased the low end of its full-year 2026 adjusted EBIT guidance to between $10.5 billion and $11 billion, reflecting confidence in ongoing performance. This uplift comes despite expected commodity headwinds of approximately $2.5 billion.
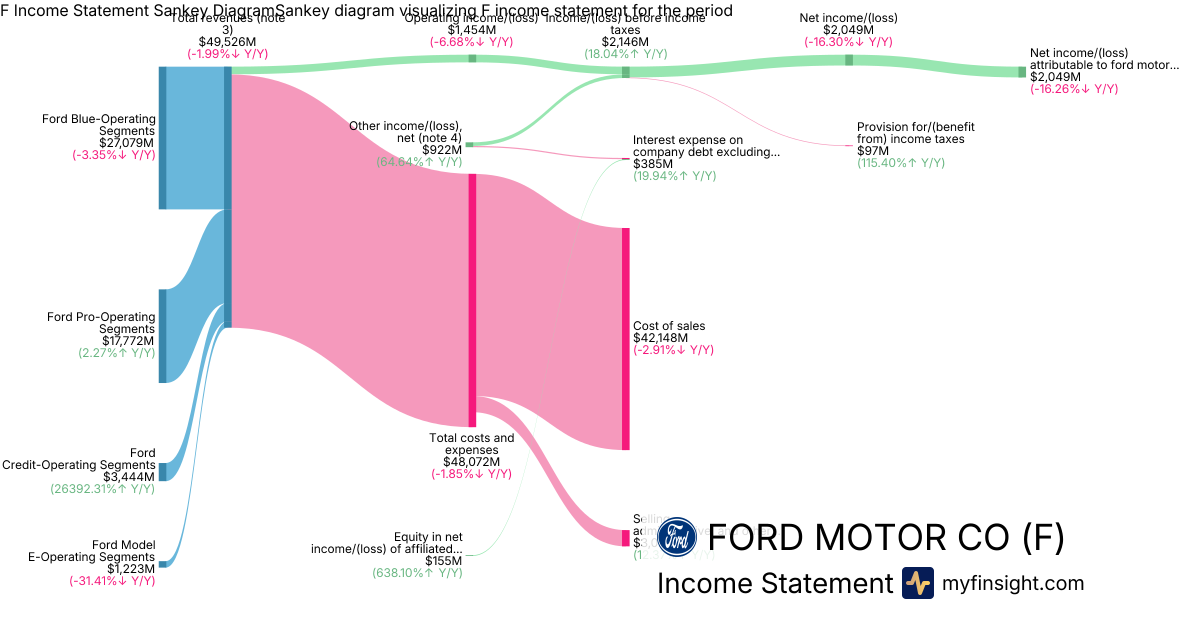
- Strong Q3 Performance and Segment Highlights: The company reported Q3 revenue of $49.5 billion, with adjusted EBIT reaching $2.7 billion, marking a 3% year-over-year increase. Ford Pro achieved $17.8 billion in revenue and $1.7 billion in adjusted EBIT, though its EBIT declined 16% due to higher commodity expenses and launch costs.
- Growth in Software Services and Parts: Software services and parts businesses achieved record revenue in Q3, contributing approximately 10% of total quarterly revenue with highly accretive margins, highlighted as increasingly important earnings contributors by management.
- Model E Losses and EV Strategy: The Model E segment reported $1.2 billion in revenue but incurred an EBIT loss of $1.1 billion, albeit an improvement of 25% year-over-year, as the company continues to invest in reducing EV costs and expand its Universal Electric Vehicle platform.
- Cost Reduction Efforts and Ford Energy Progress: Ford is on track for $1 billion in warranty and material cost reductions in 2026 (excluding Novelis and tariffs). Additionally, Ford Energy has secured contracts and late-stage negotiations covering over 80% of its 2028 annual capacity of 20 GWh, indicating strong demand and pricing consistent with investment assumptions.
Overall Takeaway
The Q3 2026 earnings call for Ford was broadly positive. The company demonstrated resilience by raising its full-year adjusted EBIT guidance despite facing significant commodity headwinds, driven by strong performance in its Ford Pro and growing software and parts businesses. While the Model E segment continues to experience losses, the year-over-year improvement and strategic investments in EV cost reduction and Ford Energy's expansion indicate a clear path forward.
|
|
Revenue
$49.5B
|
|
Net Income
$2.05B
|
|
Net Margin
4.14%
|
|
🔍 Deep Dive: PINTEREST, INC.
Period Ending 2026-09-30
|
|
🚨 Price Alert: The stock price dropped by 13.20% around the earning call.
|
Pinterest (PINS) experienced notable stock price fluctuations around its recent Q3 2026 earnings call, primarily driven by a mixed financial performance that saw the company miss analyst expectations for both earnings and revenue, despite continued robust user growth. Shares declined by 8% in after-hours trading following the earnings release on October 29, 2026. This volatility reflects investor concerns over profitability and revenue growth headwinds, particularly in the European market.
Key Factors Contributing to Volatility:
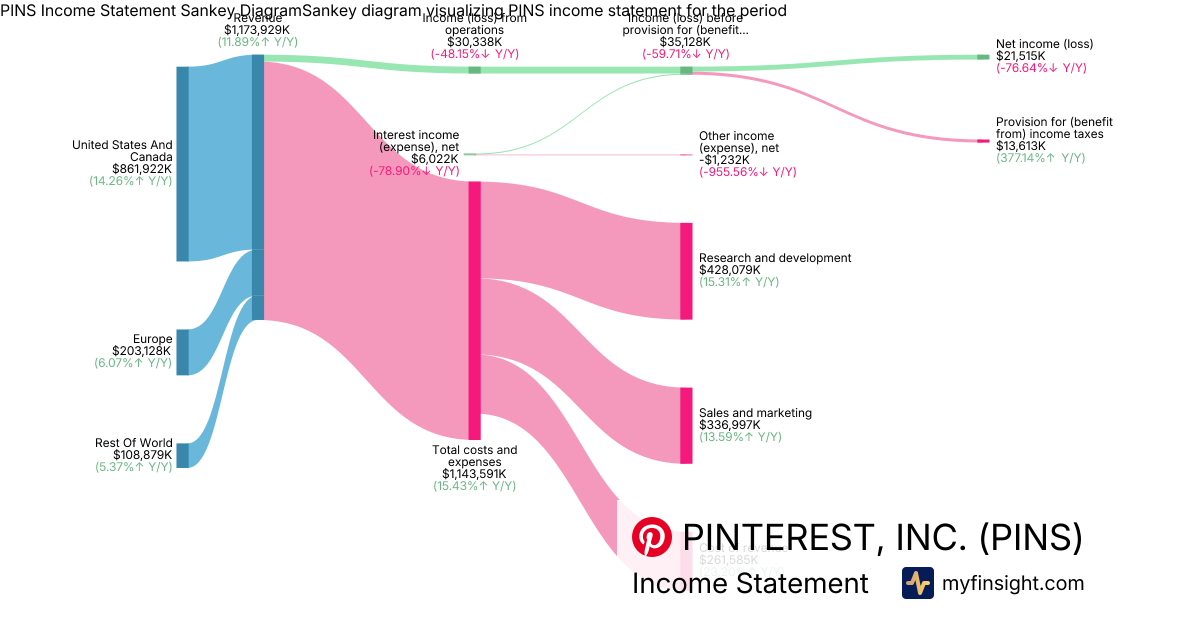
- Missed Earnings and Revenue Estimates: Pinterest reported GAAP earnings per share of $0.04, missing analyst expectations by $0.05. Quarterly revenue of $1.17 billion, while growing 11.4% year-over-year, also fell short of estimates by $40 million.
- Significant Decline in Net Income: The company's GAAP net income fell 77% to $21.5 million, contributing to investor apprehension regarding profitability.
- European Market Challenges: Revenue performance was significantly impacted by a larger-than-expected pullback from cross-border sellers in Europe, following changes to the region's de minimis exemption. While U.S. and Canada revenue grew by 14% (to $894 million according to search results), Europe revenue of $203 million was flat year-over-year, with average revenue per user declining.
- Continued User Growth: A positive highlight was the continued growth in user engagement, with global monthly active users (MAUs) reaching a record 661 million, a 10% increase year-over-year. This indicates the platform's sustained appeal despite monetization challenges.
- Cautious Outlook and Cooling Ad Growth: Pinterest provided Q4 revenue guidance projecting 8% to 12% year-over-year growth, which, while positive, reflects cautious optimism amid anticipated foreign exchange challenges and a general cooling in ad growth, where impression growth outpaced ad pricing. The company is focusing on AI-driven visual search and shopping experiences to drive future growth.
|
|
Revenue
$1.17B
|
|
Net Income
$21.5M
|
|
Net Margin
1.83%
|
|
🔍 Deep Dive: CHIPOTLE MEXICAN GRILL INC
Period Ending 2026-09-30
|
|
🚨 Price Alert: The stock price jumped by 11.24% around the earning call.
|
Chipotle Mexican Grill (CMG) has experienced notable price fluctuations around its recent earning call, primarily driven by a mixed financial performance where strong revenue growth was overshadowed by declining profitability and rising operational costs.
Key Factors Contributing to Volatility:
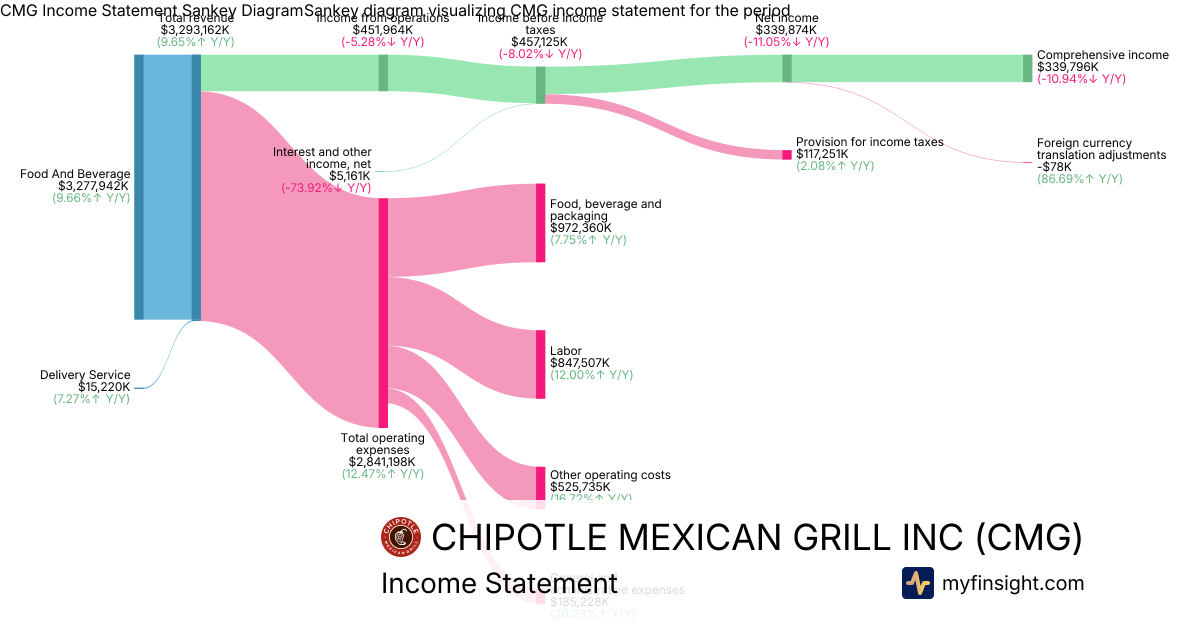
- Mixed Financial Results: Chipotle reported a significant increase in total revenue to $3.29 billion, representing a 9.6% year-over-year growth, which exceeded analyst expectations. However, diluted earnings per share (EPS) declined by 6.9% to $0.27, missing analyst estimates. This divergence likely created investor uncertainty and contributed to the stock's volatility.
- Declining Operating Margins: The company's operating margin decreased to 13.7% from 15.9% in the prior year, and restaurant-level operating margin fell to 23.3%. This contraction in profitability, despite revenue growth, raised concerns among investors.
- Rising Operational Costs: A primary driver of margin pressure was increased operational expenses. Labor costs rose to 25.7% of total revenue, driven by wage inflation and higher employee compensation. Additionally, higher general and administrative expenses, which were $185 million, and increased marketing and insurance costs also impacted overall profitability.
- Inflationary Pressures: While Chipotle managed to slightly reduce food, beverage, and packaging costs as a percentage of revenue (which totaled $972 million) through menu pricing and tariff relief, persistent inflation in beef, freight, and higher protein usage continued to challenge cost management. Total operating expenses for the quarter were $2.84 billion.
- Softening Comparable Sales Trends: Despite a 2.1% increase in comparable restaurant sales and positive transaction growth for the third consecutive quarter, the company noted a slowdown in sales momentum in mid-July and further softening in October. This mixed outlook on future comparable sales growth contributed to investor apprehension.
|
|
Revenue
$3.29B
|
|
Net Income
$340M
|
|
Net Margin
10.32%
|
|
🔍 Deep Dive: Bausch Health Companies Inc.
Period Ending 2026-09-30
|
|
🚨 Price Alert: The stock price jumped by 38.14% around the earning call.
|
Bausch Health Companies Inc. (BHC) recently experienced significant positive price fluctuations following its robust third-quarter 2026 earnings report. The primary drivers behind this upward volatility appear to be a substantial beat on earnings and revenue expectations, coupled with raised full-year guidance and continued progress in debt reduction. The stock surged in pre-market and after-hours trading, reflecting strong investor confidence in the company's performance and outlook.
Key Factors Contributing to Volatility:
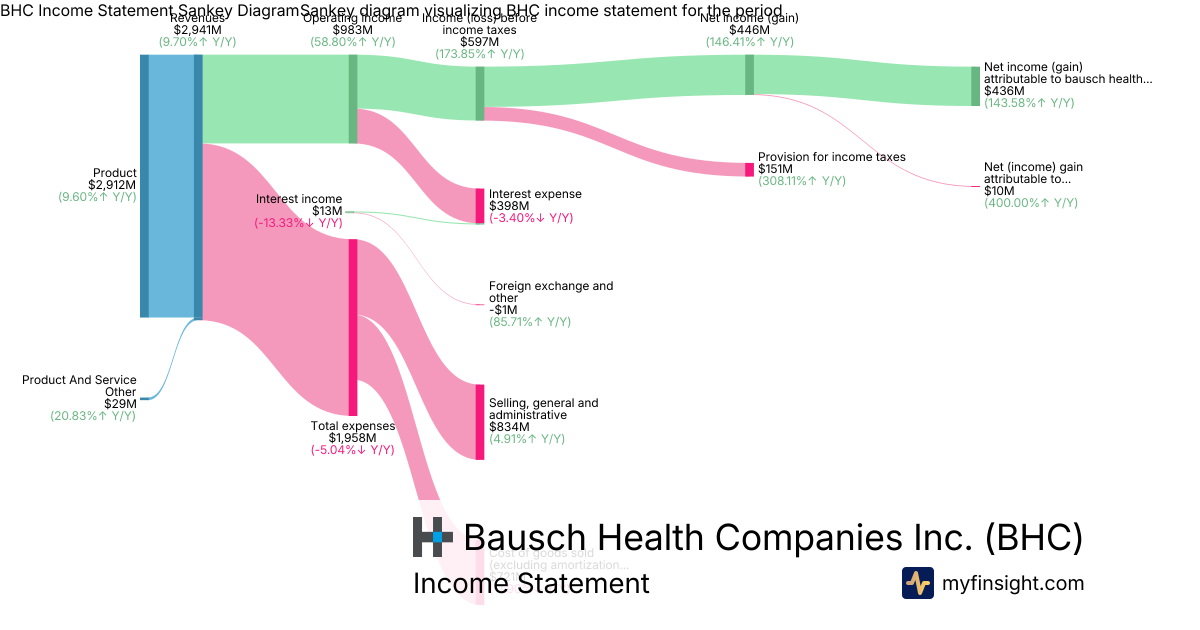
- Strong Earnings and Revenue Beat: Bausch Health reported adjusted earnings per share of $1.77, significantly surpassing analyst consensus estimates. Total revenues for the quarter reached $2.94 billion, marking a 10% year-over-year increase and also exceeding expectations.
- Raised Full-Year Guidance: Management increased its full-year 2026 consolidated revenue and adjusted EBITDA guidance for the second consecutive quarter, signaling a positive outlook for future financial performance.
- Robust Salix Segment Growth: The Salix segment was a key growth driver, with revenues climbing $831 million, an increase of 16% year-over-year, largely propelled by strong performance from Xifaxan.
- Significant Net Debt Reduction: The company demonstrated continued progress in managing its substantial debt, reducing net debt by $521 million in the third quarter and over $1 billion year-to-date, and announced plans to redeem additional senior notes.
- Consistent Core Business Performance: Bausch Health's businesses, excluding Bausch + Lomb, achieved their fourteenth consecutive quarter of year-over-year revenue and adjusted EBITDA growth, highlighting operational consistency.
|
|
Revenue
$2.94B
|
|
Net Income
$436M
|
|
Net Margin
14.82%
|
|
🔍 Deep Dive: VERIZON COMMUNICATIONS INC
Period Ending 2026-09-30
|
- Robust Subscriber Growth and Improved Efficiency: Verizon reported its strongest third-quarter postpaid phone net additions in five years, with 406,000 subscribers, and its best quarterly net account growth in over a decade with 137,000 additions. This growth was driven by a strategic shift to "revenue-positive" customer acquisition, reflected in a 41% decline in promotional acquisition costs and a 30% reduction in retention costs, leading to an improved postpaid phone churn of 0.94%.
- Significant Guidance Upgrades: For the third consecutive quarter, Verizon raised its full-year 2026 guidance across key metrics, including postpaid phone net additions (now 1.1 million to 1.2 million), Adjusted EPS (projected at $5.04 to $5.06), and free cash flow growth (expected to approach 12% year-over-year).
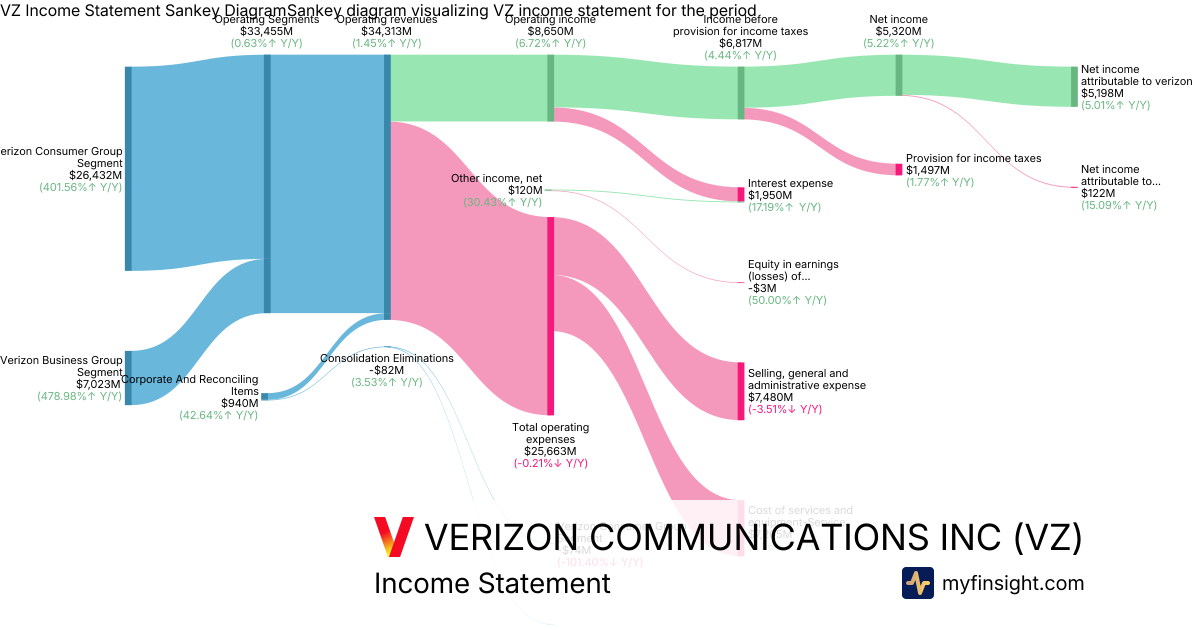
- Record Profitability and Strong Cash Flow: The company achieved a record consolidated Adjusted EBITDA of $13.8 billion, an 8.0% year-over-year increase, resulting in its highest-ever Adjusted EBITDA margin of 40.2%. Net income attributable to Verizon grew to $5.3 billion, and free cash flow increased 12.1% to $7.8 billion for the quarter.
- Mixed Revenue Performance with Service Revenue Momentum: Total operating revenue of $34.3 billion grew 1.5% year-over-year but missed analyst estimates for the third consecutive quarter, primarily due to a 9% decline in equipment revenue. However, mobility and broadband service revenue showed sequential improvement, growing 2.9% year-over-year, with expectations for further acceleration to approximately 4% in Q4.
- Strategic Expansion in AI and Broadband: Verizon is actively pursuing growth avenues beyond traditional wireless, including signing a more than $2 billion agreement with AWS, part of $4 billion in AI Connect contracts expected to contribute revenue from 2027. The company also added 314,000 broadband connections, including fixed wireless access and fiber, and remains on track to exceed 32 million fiber passings by year-end, while strategically managing fixed wireless expansion to ensure quality service.
Overall Takeaway
The Q3 fiscal 2026 earnings call for Verizon was broadly positive. Despite a modest miss on overall revenue estimates driven by lower equipment sales, the company demonstrated strong operational momentum through impressive postpaid subscriber growth driven by disciplined and profitable customer acquisition strategies. The significant improvements in profitability metrics and the third consecutive upward revision of full-year guidance for key financial indicators underscore management's confidence and the effectiveness of its strategic transformation. Investors should weigh the solid core business performance and future growth drivers in AI and broadband against the ongoing challenge of declining equipment revenue.
|
|
Revenue
$34.3B
|
|
Net Income
$5.2B
|
|
Net Margin
15.15%
|
|
🔍 Deep Dive: Roblox Corp
Period Ending 2026-09-30
|
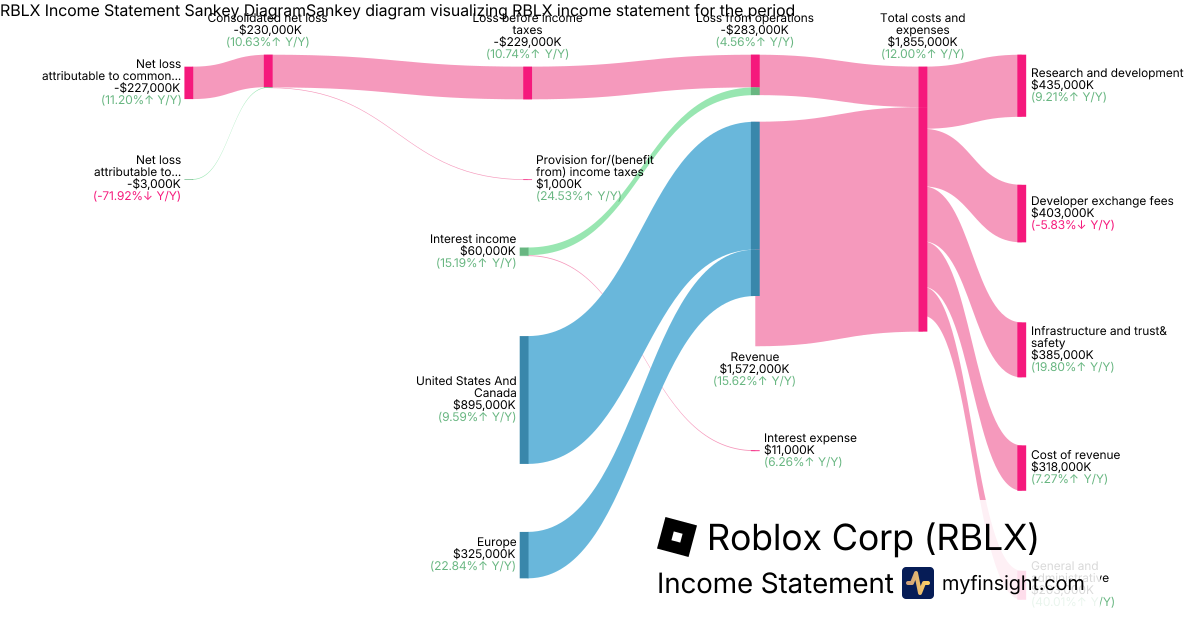
- Revenue Growth Ahead of Estimates but Decelerating: Roblox reported Q3 $1.57 billion in revenue, surpassing analyst expectations. However, this 16% year-over-year growth represents a significant deceleration from prior periods, indicating a potential shift in monetization strategies as user growth slows.
- First-Ever Decline in User Engagement and Bookings: A key concern was the first year-over-year decline in user metrics, with average daily active users (DAUs) falling 9% to 138 million and engagement hours dropping 15% to 34 billion. This, coupled with a 12% decline in bookings to $1.697 billion, signals a challenging trend in user acquisition and monetization.
- Narrower Net Loss with Improved Operational Efficiency: The company posted a -$230 million consolidated net loss, which was narrower than the prior year and better than analyst expectations. Additionally, adjusted EBITDA saw a significant 200% increase to $138 million, demonstrating improved operational efficiency despite the net loss.
- Heavy Investment in AI and Platform Infrastructure with Cautious Q4 Guidance: Roblox continues substantial investments in $435 million in Research and development and $385 million in Infrastructure and trust & safety, particularly for AI initiatives aimed at content creation and platform expansion. However, management's Q4 guidance projects a 10-15% year-over-year decline in bookings and an expected consolidated net loss of $363 million to $423 million, along with increased capital expenditures for AI infrastructure.
- Developer Payouts Remain High Amid Monetization Pressures: $403 million in Developer exchange fees underscore the ongoing cost of maintaining its creator ecosystem. The decline in bookings across all regions in Q3 2026 indicates potential monetization pressure, despite efforts to attract higher-monetizing older users.
Overall Takeaway
The Q3 fiscal 2026 earnings call for Roblox was mixed to negative. While the company exceeded revenue and EPS estimates and demonstrated improved operational efficiency through adjusted EBITDA, significant investor concerns arose from the first-ever year-over-year decline in daily active users and engagement hours, coupled with cautious Q4 bookings guidance and planned increases in AI-related capital expenditures. This led to a significant after-hours drop in shares, reflecting market anxieties about the sustainability of Roblox's growth model and its path to consistent profitability.
|
|
Revenue
$1.57B
|
|
Net Income
-$227M
|
|
Net Margin
-14.44%
|
|
🔍 Deep Dive: BAXTER INTERNATIONAL INC
Period Ending 2026-09-30
|
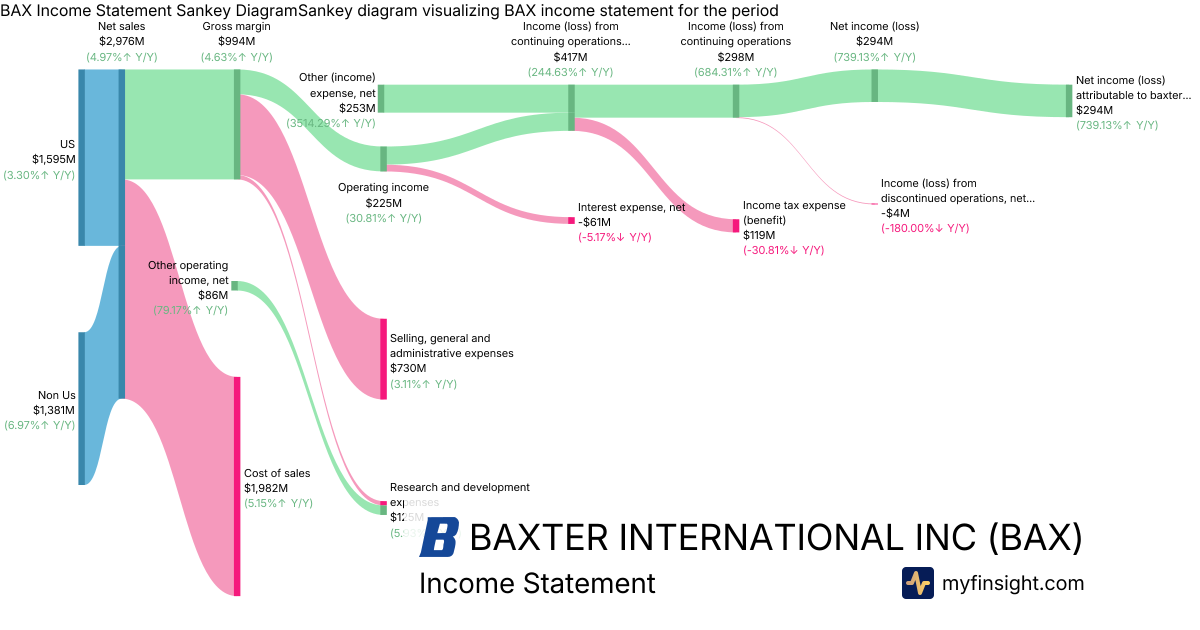
- Strong Sales Performance and Raised Outlook: Baxter reported Q3 2026 global sales of approximately $3 billion, achieving 5% growth on both a reported and organic basis, with broad-based contributions across all segments. Following this strong performance, the company raised its full-year 2026 organic sales growth guidance to 3%-4% and lifted the low end of its adjusted EPS guidance to $2.05-$2.15.
- Significant Net Income Boost from Debt Extinguishment: Net income attributable to Baxter stockholders swung to a $294 million profit in Q3 2026, compared to a loss in the prior year, significantly benefiting from a $253 million pre-tax gain from the early extinguishment of debt.
- Progress on Deleveraging and Balance Sheet Strengthening: The company completed a $600 million cash tender offer, retiring $864 million of debt, and remains committed to achieving a net leverage ratio of approximately 3.0x by year-end 2026.
- Operational Improvements and Key Growth Drivers: Management highlighted continued traction in its turnaround efforts through the Baxter GPS program, completing over 700 continuous improvement initiatives year-to-date. Growth was particularly strong in Advanced Surgery, Drug Compounding, and Infusion Systems.
- Anticipated Headwinds and Margin Pressures: Despite positive results, Baxter announced the discontinuation of cephalosporin production at its Round Lake facility, which is expected to impact 2026 sales and operating income. Management also signaled potential headwinds for 2027, including inflation, tariff uncertainties, and the cessation of transition service agreement benefits, contributing to investor caution regarding future margin expansion despite an adjusted gross margin of $38.3%.
Overall Takeaway
The Q3 fiscal 2026 earnings call for Baxter was broadly neutral to cautiously positive. While the company demonstrated strong top-line growth, exceeded earnings expectations, and made significant progress in debt reduction, a substantial portion of the net income gain was driven by a one-time debt extinguishment. Investors reacted cautiously due to ongoing margin pressures and disclosed headwinds for 2027, including product discontinuations and the end of certain revenue streams, suggesting a challenging path to sustained profitability improvements.
|
|
Revenue
$2.98B
|
|
Net Income
$294M
|
|
Net Margin
9.88%
|
|
🔍 Deep Dive: BRISTOL MYERS SQUIBB CO
Period Ending 2026-09-30
|
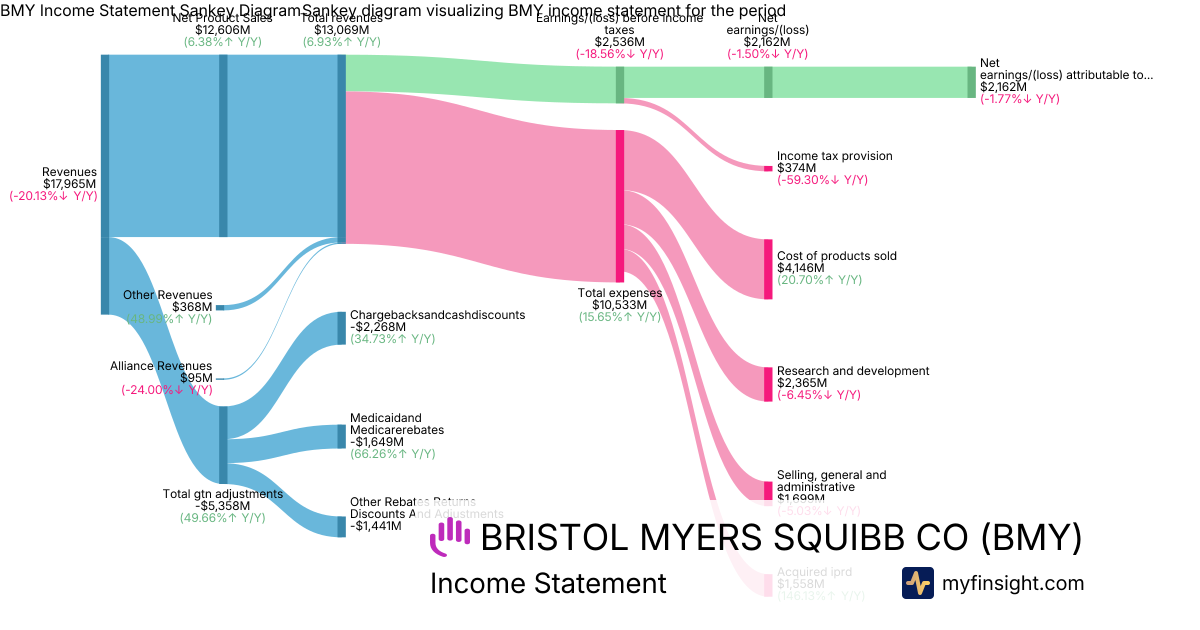
- Strong Financial Performance Exceeding Expectations: Bristol Myers Squibb reported robust third-quarter 2026 results, with total revenues of $13.1 billion, a 7% increase year-over-year, surpassing analyst estimates. Non-GAAP earnings per share of $1.35 also beat consensus estimates.
- Double-Digit Growth in Diversified "Growth Portfolio": The "Growth Portfolio" was a key driver, expanding 12% to $7.7 billion. This growth was fueled by strong performances from products such as Reblozyl ($750 million), Breyanzi ($526 million), Camzyos ($420 million), and Opdualag ($367 million), alongside the approval of Zenbexus.
- Raised Full-Year Revenue Guidance Amidst Portfolio Transition: Management raised its full-year 2026 revenue guidance to a range of $49.75 billion to $50.25 billion, reflecting strong commercial execution. However, the updated non-GAAP EPS guidance of $6.35-$6.55 includes a -$0.60 per share impact from acquired IPRD charges and licensing income.
- Managing Legacy Portfolio Decline and Future Patent Expirations: While the "Legacy Portfolio" saw a 1% increase to $5.4 billion, primarily due to Eliquis growth offsetting other generic impacts, the company anticipates a significant $1.5 billion-$2 billion Eliquis revenue decline in 2027 as loss of exclusivity begins in Europe.
- Strategic R&D Investment and Operational Efficiency: The company continues significant investment in its late-stage pipeline, highlighted by $1.56 billion in acquired IPRD charges and $2.37 billion in R&D expenses. Additionally, a $187 million provision for restructuring charges indicates ongoing efforts to optimize operations and enhance efficiency.
Overall Takeaway
The Q3 2026 earnings call for Bristol Myers Squibb was broadly positive. The company demonstrated strong top-line growth driven by its diversified "Growth Portfolio," exceeding revenue and earnings expectations, and responded by raising its full-year revenue guidance. While challenges persist with the decline of legacy products and the upcoming Eliquis loss of exclusivity in Europe, the significant investment in R&D and strategic pipeline advancements, coupled with ongoing efficiency initiatives, indicate a focused and proactive approach to navigating its portfolio transition and securing future growth.
|
|
Revenue
$13.1B
|
|
Net Income
$2.16B
|
|
Net Margin
16.54%
|
|
🔍 Deep Dive: CCC Intelligent Solutions Holdings Inc.
Period Ending 2026-09-30
|
- Strong Revenue Growth: CCC reported total revenues of $294.1 million for Q3 2026, marking a significant 10.1% increase year-over-year from $267.1 million in Q3 2025, driven by strong demand for its SaaS and AI platform.
- Significant Profitability Turnaround: The company achieved GAAP net income of $30.2 million for Q3 2026, a substantial recovery from a GAAP net loss of $2.0 million in the prior year period. GAAP operating income also notably increased to $57.4 million compared to $30.0 million in Q3 2025.
- Accelerated AI Adoption as a Key Growth Driver: The company saw strong adoption of its AI solutions, with AI-related revenue reaching an annualized run-rate of approximately $130 million in Q3 2026, representing 40% year-over-year growth, signifying a key area of future performance.
- Planned Acquisition and Suspension of Guidance: A significant development is the definitive agreement for CCC to be acquired by a consortium led by GTCR and Elliott Investment Management for $7.75 per share, representing an enterprise value of approximately $6.1 billion. This all-cash transaction, expected to close in Q1 2027, will take the company private and has led to the suspension of future financial guidance.
- Strong Cash Generation: CCC demonstrated robust cash generation, with $202.9 million in cash and cash equivalents and free cash flow of $82.5 million for the quarter, up from $78.6 million in the prior year, indicating healthy operational liquidity.
Overall Takeaway
The Q3 2026 earnings call for CCC was broadly positive, underscored by strong revenue growth and a significant turnaround in profitability from a net loss to a net income year-over-year. The continued expansion of AI solutions demonstrates a clear growth driver. However, the most material news for investors is the pending acquisition, which will take the company private and has led to the suspension of future guidance, effectively capping public investor returns at the offer price.
|
|
Revenue
$294M
|
|
Net Income
$30.2M
|
|
Net Margin
10.28%
|
|
🔍 Deep Dive: ALTRIA GROUP, INC.
Period Ending 2026-09-30
|
- Strong Earnings and Raised Guidance: Altria reported adjusted diluted earnings per share of $1.52, exceeding analyst estimates of $1.51, and slightly raised its full-year adjusted diluted EPS guidance to a range of $5.66 to $5.74, representing 4.5% to 6.0% growth from the prior year.
- Robust Revenue Performance and Segment Contributions: The company delivered total net revenues of $6.13 billion. The Smokeable Products Segment was a primary driver, contributing $5.43 billion in revenue, with management highlighting growth in operating companies income and strong brand positioning for Marlboro and Basic.
- Growth in Smoke-Free Portfolio: The Oral Tobacco Segment generated $688 million in revenue. The `on!` nicotine pouch brand demonstrated significant progress, reporting 13.3% shipment volume growth in the third quarter and expanding its product offerings.
- Significant Shareholder Returns and Investment Gains: Altria emphasized its commitment to shareholders, returning over $6 billion in the first nine months, including substantial dividends and $735 million in share repurchases. The Board also authorized a $1 billion expansion of the existing share repurchase program. Additionally, the company recognized $242 million in gains from investments in equity securities.
- Balance Sheet Snapshot: While operational performance was strong, the company's balance sheet showed $22.9 billion in long-term debt and a total stockholders' equity deficit attributable to Altria of -$2.23 billion.
Overall Takeaway
The Q3 2026 earnings call for Altria was broadly positive. The company exceeded both revenue and earnings expectations and subsequently raised its full-year EPS guidance, signaling confidence in future performance. This was driven by strong results in both its core smokeable products and the growing smoke-free portfolio, complemented by substantial returns to shareholders through dividends and an expanded share repurchase program. While the negative stockholders' equity remains a notable financial characteristic, the operational strength and positive outlook generally outweighed this concern in the context of the recent call.
|
|
Revenue
$6.13B
|
|
Net Income
$2.52B
|
|
Net Margin
41.06%
|
|
🔍 Deep Dive: KLA CORP
Period Ending 2026-09-30
|
- Record Q1 FY27 Revenue and Strong Profitability: KLA reported record quarterly revenue of $4.14 billion, marking a 29% year-over-year increase and exceeding the midpoint of guidance. The company also achieved a net income of $1.55 billion for the period.
- Unprecedented Operating Margin: KLA achieved an operating margin exceeding 46% for the first time in its company history, which reflects strong operational discipline and efficient conversion of top-line growth to profitability.
- Bullish Outlook and Market Expansion: Management provided a positive outlook, forecasting December quarter revenue (Q2 FY27) of approximately $4.7 billion. Additionally, the preliminary 2027 wafer equipment market forecast was increased to exceed $200 billion, driven by unprecedented visibility and a growing backlog.
- AI-Driven Demand and Advanced Technology Growth: Key growth drivers include significant investments in AI infrastructure, increasing process control intensity across advanced technology nodes, and strong performance in advanced packaging solutions.
- Key Segment and Geographical Contributions: The Wafer Inspection segment contributed substantially to revenue with $2.11 billion. Geographically, China ($1.43 billion) and Taiwan ($1.02 billion) continued to be significant markets driving revenue generation.
Overall Takeaway
The Q1 fiscal 2027 earnings call was broadly positive. KLA demonstrated exceptional financial performance with record revenue and operating margins, coupled with an optimistic outlook for future growth. This momentum is primarily driven by secular trends in AI and advanced semiconductor manufacturing, reinforcing investor confidence in the company's strategic positioning and operational execution.
|
|
Revenue
$4.14B
|
|
Net Income
$1.55B
|
|
Net Margin
37.44%
|
|
🔍 Deep Dive: ALNYLAM PHARMACEUTICALS, INC.
Period Ending 2026-09-30
|
|
🚨 Price Alert: The stock price dropped by 22.70% around the earning call.
|
Alnylam Pharmaceuticals (ALNY) experienced significant price volatility around its recent earnings call, despite reporting strong third-quarter financial results that surpassed analyst expectations. The downturn was primarily driven by investor concerns over slower-than-anticipated demand growth for its key therapy, Amvuttra, coupled with potential future reimbursement challenges and delays in its development pipeline.
Key Factors Contributing to Volatility:
- Non-Recurring Tax Benefit Inflates Net Income: While the company reported a substantial net income of $2.17 billion and a significant EPS beat, this was largely attributed to a non-cash tax benefit, which investors viewed as non-operational and unlikely to recur.
- Slower Amvuttra Demand Growth and Lowered Guidance: Despite robust total revenues of $1.46 billion and strong product sales, particularly for Amvuttra contributing $1.13 billion, management expressed dissatisfaction with underlying demand growth for its flagship therapy and guided full-year TTR product sales to the low end of its previously stated range.
- Concerns over Medicare Advantage and Reimbursement Policies: Investors reacted negatively to management's warnings about near-term pressures from Medicare Advantage restrictions and potential fourth-quarter ordering volatility due to anticipated changes in Centers for Medicare & Medicaid Services (CMS) drug reimbursement rules, which could impact sales of drugs like Amvuttra starting in 2027.
- Pipeline Program Delays: The company announced delays in mid-stage trial results for ALN-6400 and early-stage data for ALN-2232, pushing their expected release to February, which dampened investor enthusiasm for future growth catalysts.
- Analyst Downgrades and Market Sentiment: Following the earnings call, several analysts downgraded their ratings or cut price targets for ALNY, reflecting increased caution about the stock's near-term prospects and contributing to a significant drop in its share price.
|
|
Revenue
$1.46B
|
|
Net Income
$2.15B
|
|
Net Margin
147.78%
|
|
🔍 Deep Dive: INSMED Inc
Period Ending 2026-09-30
|
|
🚨 Price Alert: The stock price jumped by 18.66% around the earning call.
|
While Insmed (INSM) has recently experienced significant price fluctuations around its latest earnings call, the primary drivers behind the observed positive volatility appear to be a strong revenue beat driven by key product growth, a notable narrowing of its net and operating losses, and optimistic raised full-year guidance for its flagship therapies.
Key Factors Contributing to Volatility:
- Significant Revenue Beat and Robust Growth: Insmed reported total revenues of $524.4 million for Q3 2026, notably surpassing analyst estimates of approximately $499 million and marking a substantial 268% increase year-over-year.
- Narrowing of Losses: Despite reporting a net loss of -$100.3 million and an operating loss of -$89.4 million, these figures represent a significant improvement compared to the prior-year quarter's losses of $370.0 million and $366.0 million respectively, signaling progress in operational efficiency.
- Raised Full-Year Revenue Guidance: The company increased its 2026 revenue guidance for both BRINSUPRI (to $1.35 billion - $1.4 billion) and ARIKAYCE (to $460 million - $470 million), boosting investor confidence in future growth prospects.
- Strong Performance of Key Products: Revenue growth was primarily driven by BRINSUPRI, which generated $400.1 million (a 29% sequential increase), and ARIKAYCE, contributing $124.4 million (a 9% year-over-year increase).
- Solid Liquidity and Path to Cash Flow Positivity: Insmed maintained a strong liquidity position with approximately $1.1 billion in cash, cash equivalents, and marketable securities, and management's anticipation of reaching positive cash flow in 2027 further supported investor optimism.
|
|
Revenue
$524M
|
|
Net Income
-$97M
|
|
Net Margin
-18.49%
|
|
🔍 Deep Dive: Gen Digital Inc.
Period Ending 2026-10-02
|
|
🚨 Price Alert: The stock price jumped by 16.92% around the earning call.
|
Gen Digital (GEN) recently experienced significant price fluctuations, primarily driven by a strong second-quarter fiscal year 2027 earnings report that exceeded analyst expectations and a raised full-year outlook. The company's stock surged following these announcements, indicating a positive market reaction to its financial performance and strategic direction.
Key Factors Contributing to Volatility:
- "Beat and Raise" Earnings Report: GEN reported Q2 2027 revenue of $1.37 billion, surpassing analyst estimates, and posted non-GAAP earnings per share (EPS) of $0.74, beating the consensus. This strong performance was accompanied by a raised full-year fiscal 2027 revenue and EPS guidance, signaling management's confidence and acting as a major catalyst for the positive stock movement.
- Robust Revenue Growth and Customer Expansion: The company achieved a 12% year-over-year revenue increase and its sixth consecutive quarter of double-digit bookings growth. GEN also reached a record 83 million paid customers, growing by 2 million sequentially. A significant portion of its revenue, $1.36 billion, is attributed to subscription and service revenue, highlighting a strong recurring revenue model.
- Strong Segment Performance and Strategic Focus: The Trust-Based Solutions segment demonstrated robust growth of 26%, contributing $511 million in revenue, while the Cyber Safety Platform segment, with $858 million in revenue, achieved a record-high operating margin of 62%. Management also emphasized a focus on organic execution and cash generation, reassuring investors about avoiding large, risky acquisitions.
- Operational Efficiency and AI Integration: Internal deployment of AI tools has contributed to cost reductions in engineering and support operations, with AI resolving approximately half of customer service interactions, leading to improved operational efficiency.
- Balance Sheet Considerations: While the positive earnings report spurred a rally, investors continue to monitor the company's balance sheet, which includes significant long-term debt of $7.04 billion and substantial goodwill of $10.9 billion, which could be ongoing factors influencing investor sentiment. The company did report strong free cash flow, supporting dividends, buybacks, and debt reduction efforts.
|
|
Revenue
$1.37B
|
|
Net Income
$287M
|
|
Net Margin
20.96%
|
|
🔍 Deep Dive: CARRIER GLOBAL Corp
Period Ending 2026-09-30
|
Carrier Global Corporation (CARR) Q3 2026 Earnings Call Summary
- Strong Revenue Growth and Profitability: Carrier reported $6.3 billion in net sales, a 12% reported increase and 15% organic growth. Adjusted EPS grew 30% to $0.87.
- Exceptional Data Center Demand: Data center orders surged 300% in the quarter, with year-to-date orders exceeding $3 billion. This has contributed to a record backlog of over $8.5 billion.
- Broadening Growth Drivers: Beyond data centers, commercial HVAC orders rose over 60%, and residential sales in the Climate Solutions Americas (CSA) segment increased by more than 30%.
- Margin Pressures and Mitigation Efforts: While adjusted operating margin expanded 260 basis points, the company faces $550 million to $600 million in annual headwinds from input costs, tariffs, and supply chain issues. Management plans to address this through pricing actions and increased manufacturing capacity.
- Updated Full-Year Guidance: The company now expects full-year net sales of nearly $24 billion, with organic growth around 10%. Full-year adjusted EPS guidance is narrowed to $2.85-$2.90.
Overall Takeaway
The Q3 2026 earnings call for Carrier Global Corporation (CARR) was broadly positive. The company demonstrated strong execution with significant organic sales growth and a substantial increase in adjusted EPS, driven by exceptional demand in the data center sector and broadening growth across other segments. Despite facing margin pressures from increased input costs, management's proactive strategies and updated guidance indicate confidence in continued strong performance.
|
|
Revenue
$6.26B
|
|
Net Income
-$2.59B
|
|
Net Margin
-41.40%
|
|
🔍 Deep Dive: Invitation Homes Inc.
Period Ending 2026-09-30
|
- Strong Q3 Financial Performance and Upbeat Guidance: Invitation Homes reported total revenues of $731 million, a 6.3% year-over-year increase, and net income available to common stockholders of $158 million, up 15.6%. The company raised its full-year core FFO guidance midpoint to $1.95 and lifted same-store NOI growth to 1.2%.
- Aggressive Share Repurchase Program: Management announced a new $500 million share buyback authorization, building on nearly $1 billion in repurchases since December 2025, which reduced shares outstanding by 6%. This strategy capitalizes on the perceived undervaluation of its stock compared to the private market value of its homes.
- Accelerated Blended Rent Growth: Q3 saw a same-store blended rent growth of 3.0%, the strongest quarter of the year, driven by robust 4.3% renewal rent growth. New lease rents dipped slightly by 0.2% but showed a 50 basis point improvement year-over-year.
- Operational Performance and Cost Management: Despite a 2.5% increase in same-store operating expenses, same-store NOI still grew 1.1% on 1.6% revenue growth. Management highlighted efforts in centralizing HOA management and rent collection, aiming for operational modernization.
- Cautious Outlook on Market Supply: While supply from large single-family rental operators is moderating, management expressed caution regarding potential "shadow supply" from smaller landlords and increasing inventory from homebuilders offering discounts. Elevated mortgage rates present a dual impact, benefiting renewals but potentially increasing new lease supply pressure.
Overall Takeaway
The Q3 fiscal 2026 earnings call for Invitation Homes was broadly positive. The company delivered strong financial results, surpassing revenue and net income expectations, and demonstrated a clear commitment to shareholder value through an aggressive share repurchase program. The acceleration in blended rent growth, particularly from renewals, coupled with positive full-year guidance updates, indicates solid operational execution despite rising operating costs and some lingering concerns about future market supply.
|
|
Revenue
$731M
|
|
Net Income
$158M
|
|
Net Margin
21.58%
|
|
🔍 Deep Dive: CRH PUBLIC LTD CO
Period Ending 2026-09-30
|
|
Revenue
$11.4B
|
|
Net Income
$1.25B
|
|
Net Margin
10.92%
|
|
🔍 Deep Dive: Amrize Ltd
Period Ending 2026-09-30
|
|
🚨 Price Alert: The stock price jumped by 7.24% around the earning call.
|
|
Revenue
$3.77B
|
|
Net Income
$559M
|
|
Net Margin
14.82%
|
|
🔍 Deep Dive: Mobileye Global Inc.
Period Ending 2026-09-26
|
|
🚨 Price Alert: The stock price dropped by 8.69% around the earning call.
|
|
Revenue
$492M
|
|
Net Income
-$75M
|
|
Net Margin
-15.24%
|
|
🔍 Deep Dive: LKQ CORP
Period Ending 2026-09-30
|
|
🚨 Price Alert: The stock price dropped by 15.34% around the earning call.
|
|
Revenue
$3.32B
|
|
Net Income
$53M
|
|
Net Margin
1.60%
|
|
🔍 Deep Dive: COGNIZANT TECHNOLOGY SOLUTIONS CORP
Period Ending 2026-09-30
|
|
🚨 Price Alert: The stock price dropped by 10.11% around the earning call.
|
|
Revenue
$5.66B
|
|
Net Income
$627M
|
|
Net Margin
11.07%
|
|
🔍 Deep Dive: Mondelez International, Inc.
Period Ending 2026-09-30
|
|
Revenue
$9.97B
|
|
Net Income
$1.3B
|
|
Net Margin
13.09%
|
|
🔍 Deep Dive: Coinbase Global, Inc.
Period Ending 2026-09-30
|
|
🚨 Price Alert: The stock price dropped by 9.31% around the earning call.
|
|
Revenue
$1.22B
|
|
Net Income
$719M
|
|
Net Margin
59.12%
|
|
🔍 Deep Dive: Healthcare Realty Trust Inc
Period Ending 2026-09-30
|
|
Revenue
$287M
|
|
Net Income
-$15.8M
|
|
Net Margin
-5.50%
|
|
🔍 Deep Dive: EBAY INC
Period Ending 2026-09-30
|
|
Revenue
$3.21B
|
|
Net Income
$497M
|
|
Net Margin
15.50%
|
|
🔍 Deep Dive: EMCOR Group, Inc.
Period Ending 2026-09-30
|
|
Revenue
$5.54B
|
|
Net Income
$400M
|
|
Net Margin
7.22%
|
|
🔍 Deep Dive: Intercontinental Exchange, Inc.
Period Ending 2026-09-30
|
|
Revenue
$2.77B
|
|
Net Income
$940M
|
|
Net Margin
34.00%
|
|
🔍 Deep Dive: QUANTA SERVICES, INC.
Period Ending 2026-09-30
|
|
Revenue
$12B
|
|
Net Income
$695M
|
|
Net Margin
5.78%
|
|
🔍 Deep Dive: Mastercard Inc
Period Ending 2026-09-30
|
|
Revenue
$9.81B
|
|
Net Income
$4.63B
|
|
Net Margin
47.19%
|
|
🔍 Deep Dive: LINDE PLC
Period Ending 2026-09-30
|
|
Revenue
$9.4B
|
|
Net Income
$1.69B
|
|
Net Margin
17.99%
|
|
🔍 Deep Dive: TEXTRON INC
Period Ending 2026-10-03
|
|
🚨 Price Alert: The stock price jumped by 13.17% around the earning call.
|
|
Revenue
$3.75B
|
|
Net Income
$270M
|
|
Net Margin
7.20%
|
|
🔍 Deep Dive: HUNTINGTON INGALLS INDUSTRIES, INC.
Period Ending 2026-09-30
|
|
🚨 Price Alert: The stock price jumped by 15.43% around the earning call.
|
|
Revenue
$3.54B
|
|
Net Income
$218M
|
|
Net Margin
6.16%
|
|
🔍 Deep Dive: ELI LILLY & Co
Period Ending 2026-09-30
|
|
🚨 Price Alert: The stock price jumped by 8.10% around the earning call.
|
|
Revenue
$24.4B
|
|
Net Income
$6.45B
|
|
Net Margin
26.44%
|
|
🔍 Deep Dive: WILLIS TOWERS WATSON PLC
Period Ending 2026-09-30
|
|
Revenue
$2.46B
|
|
Net Income
$303M
|
|
Net Margin
12.32%
|
|
🔍 Deep Dive: Vulcan Materials CO
Period Ending 2026-09-30
|
|
Revenue
$2.18B
|
|
Net Income
$362M
|
|
Net Margin
16.58%
|
|
🔍 Deep Dive: KIMCO REALTY CORP
Period Ending 2026-09-30
|
|
🚨 Price Alert: The stock price jumped by 7.48% around the earning call.
|
|
Revenue
$546M
|
|
Net Income
$272M
|
|
Net Margin
49.89%
|
|
🔍 Deep Dive: DECKERS OUTDOOR CORP
Period Ending 2026-09-30
|
|
Revenue
$1.48B
|
|
Net Income
$316M
|
|
Net Margin
21.32%
|
|
🔍 Deep Dive: Trane Technologies plc
Period Ending 2026-09-30
|
|
🚨 Price Alert: The stock price dropped by 8.55% around the earning call.
|
|
Revenue
$6.76B
|
|
Net Income
$1.05B
|
|
Net Margin
15.51%
|
|
🔍 Deep Dive: Bunge Global SA
Period Ending 2026-09-30
|
|
🚨 Price Alert: The stock price dropped by 6.07% around the earning call.
|
|
Revenue
$23.8B
|
|
Net Income
$318M
|
|
Net Margin
1.34%
|
|
🔍 Deep Dive: HERSHEY CO
Period Ending 2026-09-27
|
|
Revenue
$3.28B
|
|
Net Income
$581M
|
|
Net Margin
17.73%
|
|
🔍 Deep Dive: PRICE T ROWE GROUP INC
Period Ending 2026-09-30
|
|
Revenue
$2B
|
|
Net Income
$612M
|
|
Net Margin
30.54%
|
|
🔍 Deep Dive: PRINCIPAL FINANCIAL GROUP INC
Period Ending 2026-09-30
|
|
Revenue
$4.62B
|
|
Net Income
$632M
|
|
Net Margin
13.69%
|
|
🔍 Deep Dive: SMITH A O CORP
Period Ending 2026-09-30
|
|
🚨 Price Alert: The stock price jumped by 6.44% around the earning call.
|
|
Revenue
$940M
|
|
Net Income
$126M
|
|
Net Margin
13.43%
|
|
🔍 Deep Dive: INCYTE CORP
Period Ending 2026-09-30
|
|
Revenue
$1.56B
|
|
Net Income
-$785M
|
|
Net Margin
-50.40%
|
|
🔍 Deep Dive: NORTHERN TRUST CORP
Period Ending 2026-09-30
|
|
Revenue
$1.37B
|
|
Net Income
$627M
|
|
Net Margin
45.64%
|
|
🔍 Deep Dive: ECOLAB INC.
Period Ending 2026-09-30
|
|
Revenue
$4.69B
|
|
Net Income
$551M
|
|
Net Margin
11.74%
|
|
🔍 Deep Dive: FIRST SOLAR, INC.
Period Ending 2026-09-30
|
|
Revenue
$1.23B
|
|
Net Income
$571M
|
|
Net Margin
46.39%
|
|
🔍 Deep Dive: HASBRO, INC.
Period Ending 2026-09-27
|
|
Revenue
$1.6B
|
|
Net Income
$394M
|
|
Net Margin
24.73%
|
|
🔍 Deep Dive: EDISON INTERNATIONAL
Period Ending 2026-09-30
|
|
Revenue
$4.89B
|
|
Net Income
$724M
|
|
Net Margin
14.82%
|
|
🔍 Deep Dive: Seagate Technology Holdings plc
Period Ending 2026-10-02
|
|
Revenue
$4.23B
|
|
Net Income
$1.76B
|
|
Net Margin
41.51%
|
|
🔍 Deep Dive: Otis Worldwide Corp
Period Ending 2026-09-30
|
|
Revenue
$3.91B
|
|
Net Income
$414M
|
|
Net Margin
10.58%
|
|
🔍 Deep Dive: FedEx Freight Holding Company, Inc.
Period Ending 2026-09-30
|
|
Revenue
$2.44B
|
|
Net Income
$147M
|
|
Net Margin
6.02%
|
|
🔍 Deep Dive: MID AMERICA APARTMENT COMMUNITIES INC.
Period Ending 2026-09-30
|
|
Revenue
$560M
|
|
Net Income
$83.1M
|
|
Net Margin
14.83%
|
|
🔍 Deep Dive: WEST PHARMACEUTICAL SERVICES INC
Period Ending 2026-09-30
|
|
Revenue
$874M
|
|
Net Income
$214M
|
|
Net Margin
24.47%
|
|
🔍 Deep Dive: ERIE INDEMNITY CO
Period Ending 2026-09-30
|
|
Revenue
$1.07B
|
|
Net Income
$182M
|
|
Net Margin
17.01%
|
|
🔍 Deep Dive: HCA Healthcare, Inc.
Period Ending 2026-09-30
|
|
Revenue
$19.8B
|
|
Net Income
$1.58B
|
|
Net Margin
7.96%
|
|
🔍 Deep Dive: Howmet Aerospace Inc.
Period Ending 2026-09-30
|
|
Revenue
$2.7B
|
|
Net Income
$567M
|
|
Net Margin
20.98%
|
|
🔍 Deep Dive: DAVITA INC.
Period Ending 2026-09-30
|
|
🚨 Price Alert: The stock price jumped by 9.33% around the earning call.
|
|
Revenue
$3.58B
|
|
Net Income
$223M
|
|
Net Margin
6.23%
|
|
🔍 Deep Dive: DEXCOM INC
Period Ending 2026-09-30
|
|
Revenue
$1.34B
|
|
Net Income
$275M
|
|
Net Margin
20.46%
|
|
This newsletter is sent from
MyFinsight.com.
Was this email forwarded to you? Sign up here.
Unsubscribe
Copyright © 2026 MyFinsight, All rights reserved.
|