🚨 TERAWULF INC., 🚨 DraftKings Inc., 🚨 Super Micro Computer, Inc., 🚨 Compass, Inc., 🚨 Moderna, Inc.

|

|
|
Daily Summary
|
November 06, 2026
|
Welcome to your daily digest. Today we are analyzing the latest income statements and filings from:
|
|
|
|
🔍 Deep Dive: TERAWULF INC.
Period Ending 2026-09-30
|
|
🚨 Price Alert: The stock price dropped by 10.82% around the earning call.
|
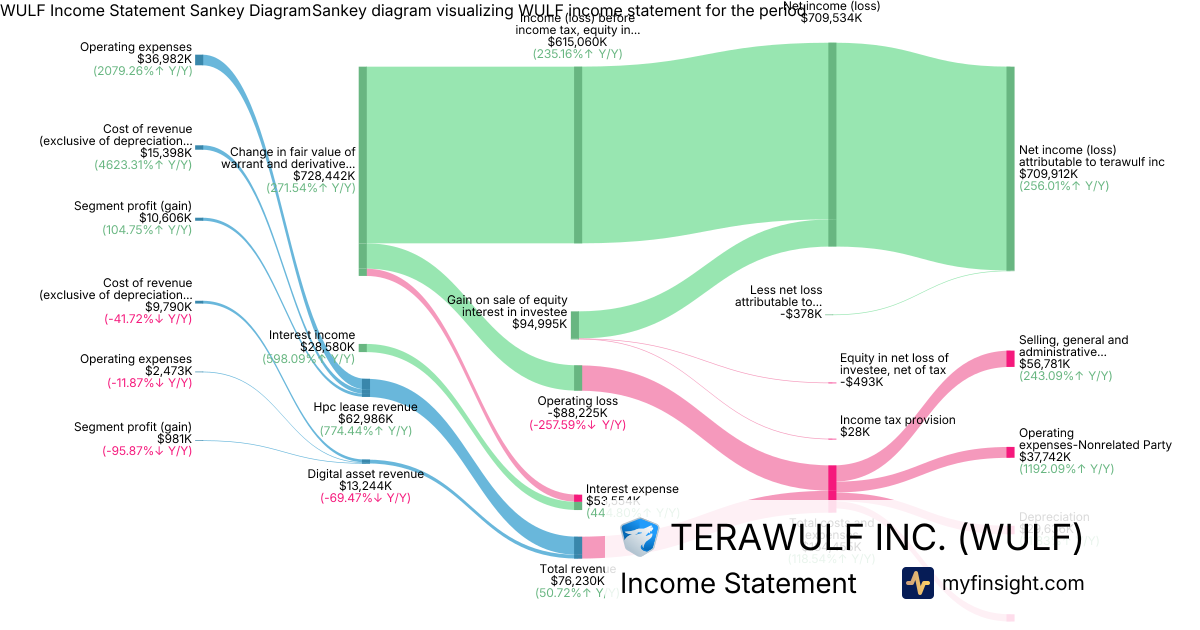
TeraWulf (WULF) has recently experienced notable price fluctuations around its earnings call, primarily driven by a significant divergence between its reported net income and an underlying operating loss. This volatility also stems from the substantial impact of non-cash gains related to derivative liabilities and investor reactions to the company's evolving business model.
Key Factors Contributing to Volatility:
- Discrepancy Between Net Income and Operating Loss: WULF reported a positive net income (loss) attributable to TeraWulf Inc of 710 million, which contrasts sharply with an operating loss of -88.2 million. This significant difference is largely due to non-cash financial adjustments rather than core business profitability.
- Impact of Warrant and Derivative Valuations: A substantial 728 million gain from the change in fair value of warrant and derivative liabilities significantly boosted the reported net income. The presence of warrant liabilities totaling 1.09 billion on the balance sheet means that fair value fluctuations of these complex instruments introduce considerable volatility to reported earnings.
- Evolving Revenue Mix and Operational Concerns: While total revenues reached 76.2 million, driven primarily by HPC lease revenue of 63 million, the widening operating loss indicates challenges in achieving profitability from core operations as the company shifts from digital asset mining to high-performance computing (HPC) leasing.
- High Debt Load: WULF maintains a substantial long-term debt burden, including 3.03 billion in senior notes and 1.63 billion in convertible notes. Despite a healthy cash and cash equivalents balance of 1.6 billion, the significant debt levels can be a concern for investors, impacting sentiment.
- Market Interpretation of Earnings Quality: Investor reactions are likely influenced by the need to differentiate between sustainable operational improvements and non-cash or non-recurring gains, leading to varied interpretations of the company's financial health and consequently, sharp price movements.
|
|
Revenue
$76.2M
|
|
Net Income
$710M
|
|
Net Margin
931.28%
|
|
🔍 Deep Dive: DraftKings Inc.
Period Ending 2026-09-30
|
|
🚨 Price Alert: The stock price dropped by 10.67% around the earning call.
|
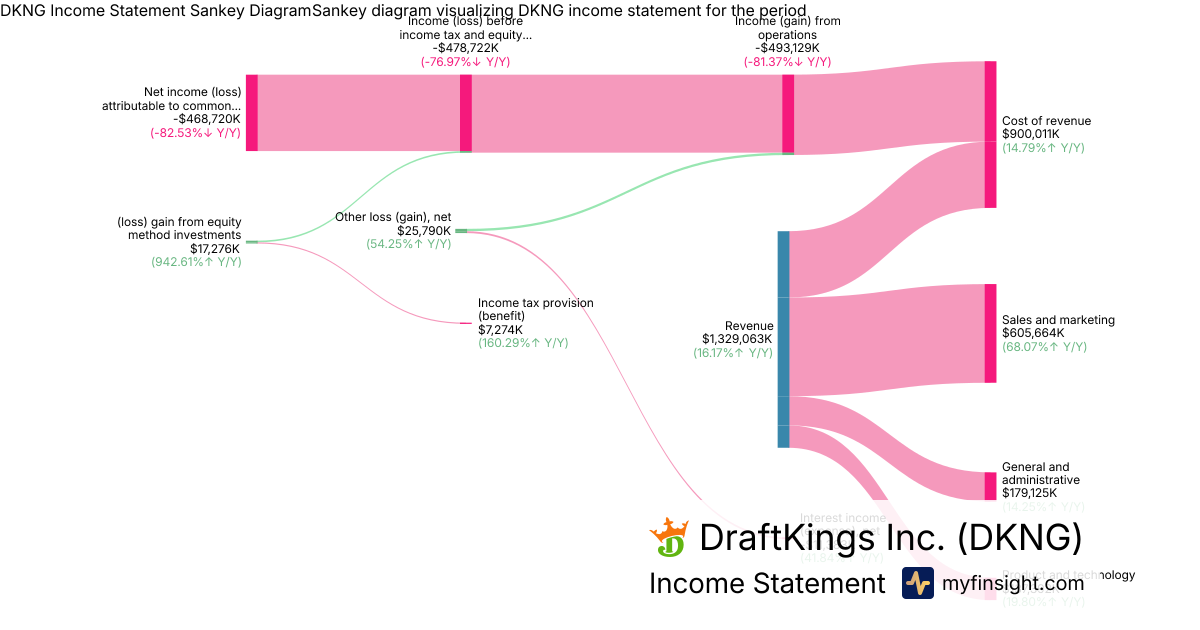
DraftKings (DKNG) stock has recently experienced violent price fluctuations, primarily driven by a significant miss on its Q3 2026 earnings expectations, coupled with lowered full-year guidance, despite continued revenue growth. Investors reacted negatively to wider-than-anticipated losses and increased strategic investments impacting near-term profitability.
Key Factors Contributing to Volatility:
- Earnings Miss and Widened Losses: DraftKings reported Q3 2026 revenues of $1.33 billion, falling short of analyst consensus, and a significantly widened net loss attributable to common stockholders of $469 million, exceeding analyst loss expectations.
- Aggressive Investment in "Predictions": A primary reason for the increased losses and a substantial cut to the 2026 adjusted EBITDA guidance is the company's heavy strategic investment in its new "Predictions" offering, aimed at future growth.
- High Operating Expenses: The company continues to incur significant operating costs, notably sales and marketing expenses of $606 million, contributing to a substantial operating loss of $493 million and a long-standing accumulated deficit of $6.95 billion.
- Lowered Full-Year Guidance: DraftKings revised its full-year 2026 revenue and adjusted EBITDA outlook downwards, which further disappointed investors and signaled a longer path to profitability.
- Analyst Disappointment and Price Target Cuts: The earnings miss and revised guidance led to significant analyst disappointment, with many reducing their price targets for DKNG stock, causing shares to plunge between 21% and 29% immediately following the earnings report.
|
|
Revenue
$1.33B
|
|
Net Income
-$469M
|
|
Net Margin
-35.27%
|
|
🔍 Deep Dive: Super Micro Computer, Inc.
Period Ending 2026-09-30
|
|
🚨 Price Alert: The stock price dropped by 16.47% around the earning call.
|
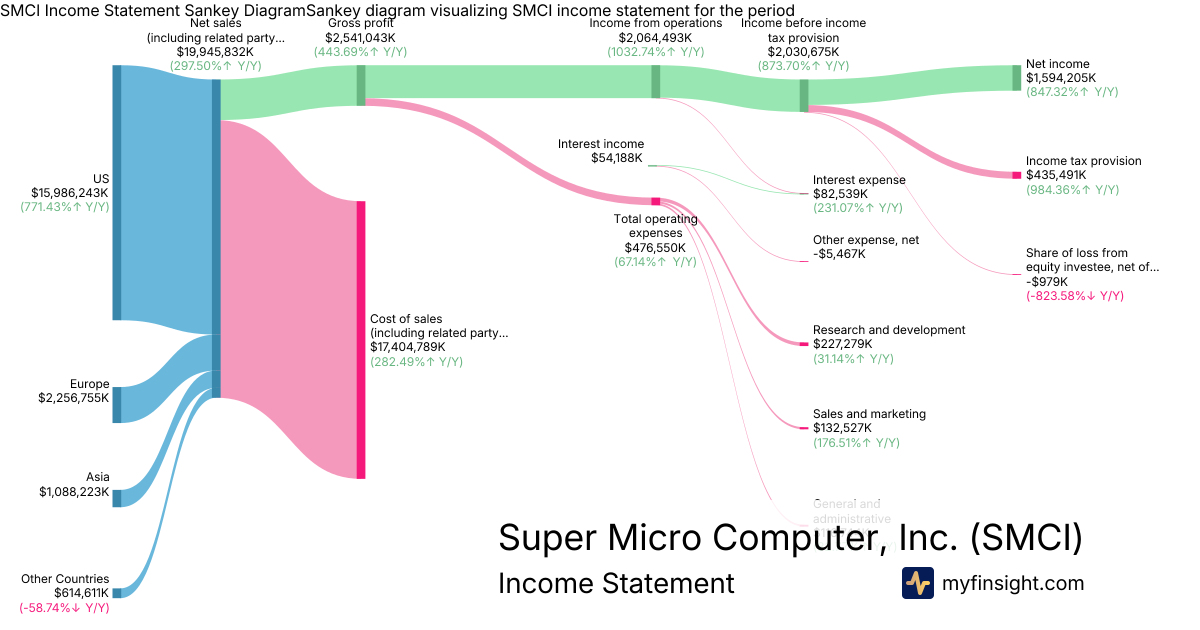
Super Micro Computer (SMCI) has experienced notable price fluctuations around its recent earnings call, primarily driven by a combination of exceptional revenue growth fueled by artificial intelligence (AI) demand, alongside investor scrutiny over gross margins, working capital, and customer concentration.
Key Factors Contributing to Volatility:
- Record Revenue Growth Driven by AI: SMCI reported record net sales of $19.9 billion in Q1 fiscal 2027, marking a nearly 298% year-over-year increase and significantly surpassing analyst estimates, largely attributed to surging demand for AI data center deployments.
- Optimistic Future Guidance: The company provided an aggressive outlook, raising its full fiscal year 2027 revenue guidance to a range of $72 billion to $82 billion, indicating strong anticipated continued demand for its AI server solutions.
- Gross Margin Compression: Despite robust top-line growth, SMCI's non-GAAP gross margin sequentially declined to 12.8%, a trend attributed to a shift towards larger, lower-margin AI deployments, which has raised concerns among some analysts regarding sustained profitability.
- Working Capital and Cash Flow Challenges: The rapid scaling required by its hardware-intensive business has led to negative operating cash flow and free cash flow in the quarter, with significant capital tied up, particularly in inventories, raising questions about cash conversion efficiency.
- Customer Concentration and Market Scrutiny: A substantial 44% of SMCI's recent revenue originated from a single unnamed customer, likely SpaceX, leading to analyst apprehension about revenue diversification and the sustainability of growth, as the market closely evaluates SMCI's ability to maintain momentum and profitability.
|
|
Revenue
$19.9B
|
|
Net Income
$1.59B
|
|
Net Margin
7.99%
|
|
🔍 Deep Dive: Compass, Inc.
Period Ending 2026-09-30
|
|
🚨 Price Alert: The stock price jumped by 8.73% around the earning call.
|
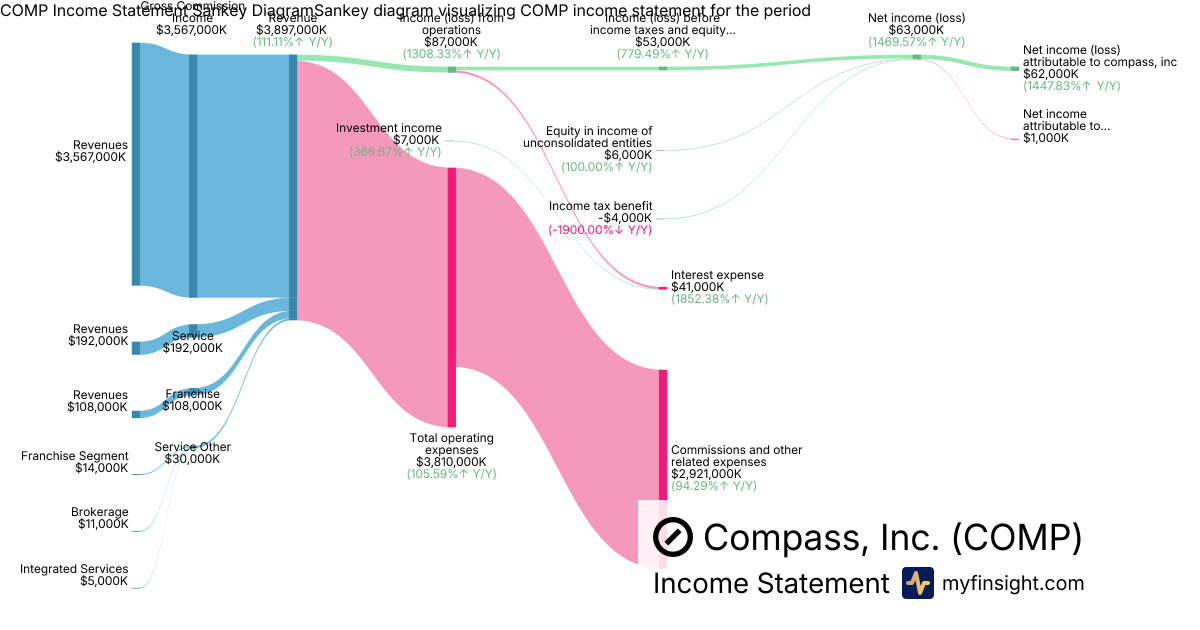
Compass (COMP) has experienced significant price volatility around its recent earnings call, driven by a combination of narrow profitability, substantial debt, ongoing integration costs, and the inherent sensitivity of its core brokerage business to market trends. While the company reported increased revenue, underlying financial metrics and the challenging macroeconomic environment for real estate appear to be key factors influencing investor sentiment.
Key Factors Contributing to Volatility:
- Slim Profitability Amidst High Revenue: Despite reporting revenue of $3.9 billion, Compass's net income was $63 million. This indicates thin margins, heavily impacted by commissions and other related expenses of $2.92 billion, making the company susceptible to fluctuations in revenue or operating costs.
- Significant Debt and Interest Expense: The company carries a considerable long-term debt of $3.14 billion, contributing to substantial interest expenses of $41 million. High leverage can amplify financial risk and investor concerns, especially in periods of rising interest rates or economic uncertainty.
- Ongoing Integration and Restructuring Costs: Compass incurred Anywhere merger transaction and integration expenses of $28 million and restructuring costs of $4 million. These non-operating expenses can weigh on short-term profitability and suggest ongoing operational adjustments.
- Heavy Reliance on Brokerage Segment Performance: With the dominant brokerage segment generating $3.58 billion in revenue, Compass's financial health is highly susceptible to cyclical downturns or shifts in the broader real estate market, which is currently facing challenges such as high mortgage rates and weak existing home sales.
- Market Sentiment and Future Outlook: The combination of these financial characteristics, coupled with a challenging macroeconomic backdrop for real estate, can lead to heightened investor reactions to earnings results and future guidance. For Q2 2026, Compass reported an EPS of $0.11, missing analysts' estimates of $0.22 by 50.00%. This suggests that even with positive net income, any perceived weakness in outlook or missed expectations can trigger significant price fluctuations.
|
|
Revenue
$3.9B
|
|
Net Income
$62M
|
|
Net Margin
1.59%
|
|
🔍 Deep Dive: Moderna, Inc.
Period Ending 2026-09-30
|
|
🚨 Price Alert: The stock price jumped by 14.11% around the earning call.
|
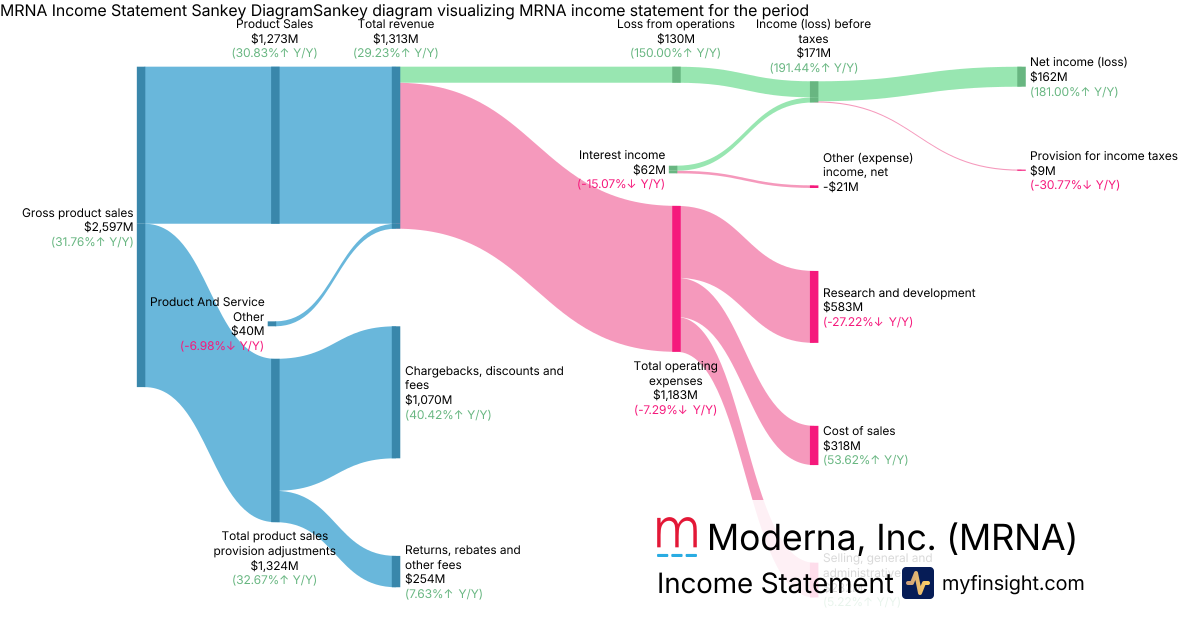
Moderna (MRNA) has recently experienced violent price fluctuations, primarily driven by its stronger-than-expected Q3 2026 earnings, robust revenue growth, and a raised full-year outlook. These positive financial results, coupled with pipeline advancements and a strengthened balance sheet, have significantly boosted investor confidence, leading to notable stock movements.
Key Factors Contributing to Volatility:
- Strong Q3 Earnings Beat: Moderna reported a total revenue of $1.31 billion, marking a 29% increase year-over-year and substantially surpassing analyst estimates. The company also swung to a net income of $162 million, or $0.38 per diluted share, significantly beating expectations and reversing a loss from the prior year.
- Raised 2026 Revenue Outlook: Management increased its full-year 2026 revenue growth forecast to 15%-25%, up from its previous outlook of up to 10%. This upward revision reflects management's confidence in sustained sales momentum.
- Operational Efficiency and R&D Reduction: Profitability was further bolstered by a 27% year-over-year decrease in Research and Development (R&D) expenses to $583 million. This reduction was primarily due to the winding down of certain late-stage infectious disease studies and ongoing cost-cutting initiatives.
- Advancements in Pipeline: Positive Phase 3 results for its personalized cancer vaccine (intismeran autogene) developed with Merck in melanoma, showing a 42% reduction in recurrence or death, and the U.S. FDA approval of its seasonal influenza vaccine (mFLUSIVA) highlight the company's progress in diversifying its product portfolio beyond COVID-19.
- Strengthened Financial Position: Moderna raised its year-end cash and investments outlook to $8.1-$8.3 billion, partly driven by approximately $2.6 billion in net proceeds from a convertible notes financing. This enhanced financial flexibility supports future investments and growth initiatives.
|
|
Revenue
$1.31B
|
|
Net Income
$162M
|
|
Net Margin
12.34%
|
|
🔍 Deep Dive: FREEPORT-MCMORAN INC
Period Ending 2026-09-30
|
|
🚨 Price Alert: The stock price dropped by 10.16% around the earning call.
|
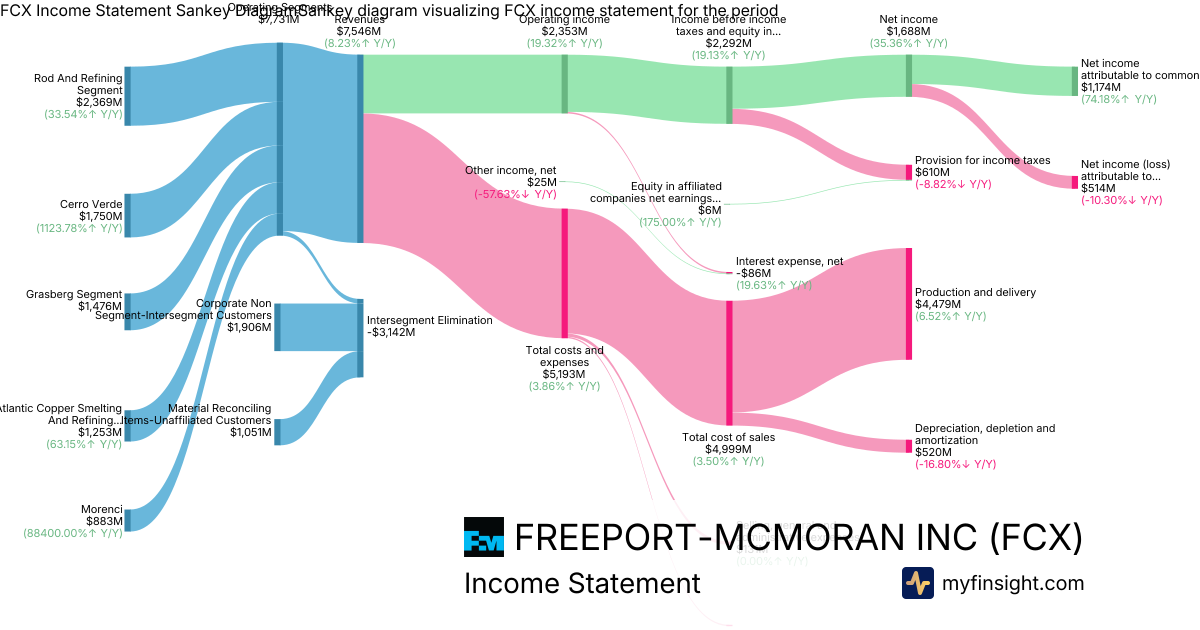
Freeport-McMoRan (FCX) has recently experienced notable stock price fluctuations, primarily driven by a mixed reaction to its Q3 2026 earnings report, concerns over future guidance, and the inherent volatility associated with commodity markets. Despite beating analyst expectations for both revenue and earnings, the stock saw a significant selloff, indicating that underlying concerns about the company's outlook overshadowed the strong headline numbers.
Key Factors Contributing to Volatility:
- Mixed Q3 2026 Earnings Performance: FCX reported Q3 2026 revenues of $7.55 billion, surpassing analyst estimates of $7.36 billion. Earnings per share (EPS) of $0.88 also beat the consensus estimate of $0.80 or $0.82. However, this positive earnings beat did not prevent a sharp selloff, suggesting investors were focused on other factors.
- Trimmed Copper Sales Guidance and Rising Capex: A major driver of negative sentiment was the company's decision to cut its copper sales guidance for 2026 and 2027 by approximately 2% to 2.5%, attributed to mine-plan changes and El Niño-related water limits. Additionally, projected 2027 capital expenditures increased by $400 million to approximately $5.2 billion, raising concerns about future cash flow and execution.
- Commodity Price Sensitivity: As a leading copper, gold, and molybdenum producer, FCX's revenues are highly susceptible to fluctuations in commodity prices. For Q3 2026, the company reported significant revenues from its core products, including $2.95 billion from refined copper products (copper cathode), $535 million from gold, and $715 million from molybdenum. Higher realized prices for copper and molybdenum contributed to revenue growth, but any perceived future weakness in these markets can significantly impact investor sentiment.
- Grasberg Mine Recovery Progress: A positive operational highlight was the ongoing recovery and ramp-up of the Grasberg mine in Indonesia. Quarterly copper output significantly increased, with management stating the ramp is 67% complete and targeting 80% capacity by mid-2027 and full capacity by the end of 2027. This operational improvement provides a bullish outlook for future production volumes.
- Strong Liquidity and Manageable Debt: The company maintained a solid financial position, reporting $4.33 billion in cash and cash equivalents, and a manageable net debt position. This liquidity helps support ongoing operations and growth initiatives amidst volatile market conditions and increased capital expenditures.
|
|
Revenue
$7.55B
|
|
Net Income
$1.17B
|
|
Net Margin
15.56%
|
|
🔍 Deep Dive: Under Armour, Inc.
Period Ending 2026-09-30
|
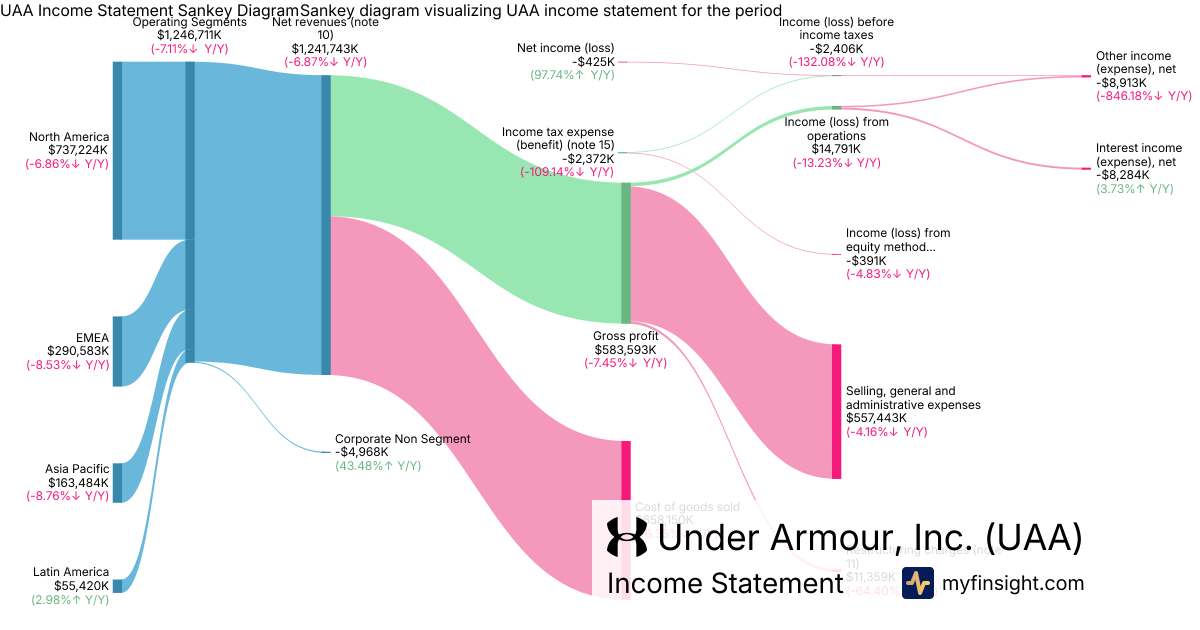
- Revenue Decline with North America Weakness: Under Armour reported net revenues of $1.24 billion for the second quarter of fiscal 2027, representing a 7% decline year-over-year. North America revenue specifically fell 7%, although the overall revenue figure slightly exceeded analysts' consensus estimates.
- Profitability Pressure with Adjusted Operating Income Beat: While the company reported a net loss of -$425 thousand (breakeven), its GAAP operating income stood at $14.8 million. Notably, the adjusted operating income, excluding certain charges, reached $25 million, surpassing management's previous outlook. Gross margin saw a 30-basis-point decline to 47.0%, influenced by unfavorable foreign currency and mix.
- Ongoing Restructuring Efforts: Under Armour incurred $11 million in restructuring charges during the quarter as part of its Fiscal 2025 Restructuring Plan. This plan, which is expected to be substantially complete by December 31, 2026, aims to improve financial and operational efficiency.
- Elevated Inventory Levels and Strategic Adjustments: Inventory remained elevated at $1.1 billion, reflecting a 4% increase year-over-year. This was attributed to inventory levels being above planned sales needs following a reduction in revenue outlook in August. Management plans to simplify the product line by reducing SKUs by nearly 50%.
- Updated Fiscal 2027 Outlook: The company maintained its full-year adjusted diluted EPS guidance at $0.08-$0.12 and reiterated its adjusted operating income outlook of $140-$160 million. However, the gross margin expansion target was revised downward due to additional external cost pressures and planned inventory actions.
Overall Takeaway
The Q2 fiscal 2027 earnings call for Under Armour was neutral to slightly negative. While the company exceeded revenue estimates and its adjusted operating income outlook, the overall revenue decline, persistent net loss, and continued gross margin pressure present ongoing challenges. Elevated inventory levels and a downward revision to gross margin expansion guidance indicate areas needing further attention, despite management's strategic efforts to streamline the business and enhance brand performance.
|
|
Revenue
$1.24B
|
|
Net Income
-$425K
|
|
Net Margin
-0.03%
|
|
🔍 Deep Dive: AKAMAI TECHNOLOGIES INC
Period Ending 2026-09-30
|
|
🚨 Price Alert: The stock price dropped by 16.39% around the earning call.
|
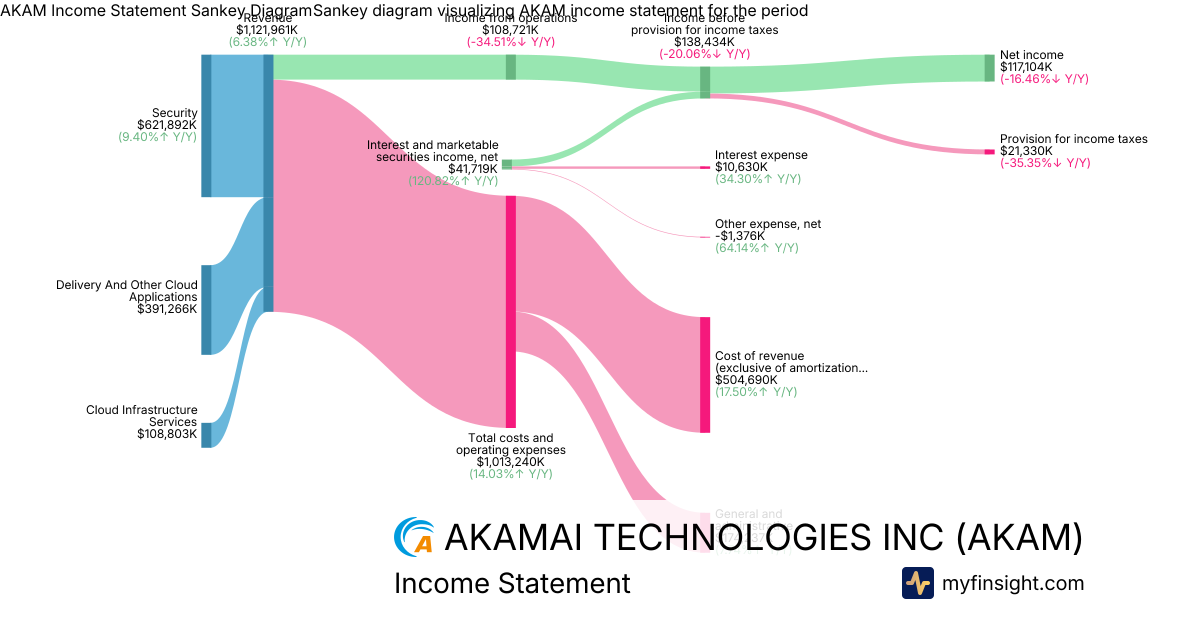
Akamai (AKAM) has experienced significant stock price volatility around its recent earnings call, likely driven by a combination of its reported financial performance, particularly within key segments, and market interpretations regarding future growth and financial health. The company's Q3 2026 earnings showed a revenue increase of 6% year-over-year to $1.122 billion, slightly above consensus estimates, with non-GAAP diluted EPS declining 5% to $1.77.
Key Factors Contributing to Volatility:
- Robust Cloud Infrastructure Services (CIS) Commitments and Growth: Akamai signed over $14 billion in multi-year CIS commitments in 2026, including a significant $11.6 billion, seven-year deal with Anthropic. CIS revenue increased by 34% year-over-year to $109 million in Q3, and is projected to more than double in 2027, driving total company revenue growth of 17%-22% in constant currency. This strong outlook is a major positive driver, but potential execution risks or the timing of revenue recognition could introduce volatility.
- Solid Security Segment Performance: The Security segment continues to be a strong performer, with revenue of $622 million in Q3, up 9% year-over-year. This growth is fueled by demand for web app firewall, API security, and Guardicore Segmentation solutions. Consistent performance in this high-growth area supports investor confidence.
- Profitability and Operating Expenses: Akamai reported GAAP net income of $117 million and non-GAAP net income of $262 million, with non-GAAP EPS of $1.77, which beat analyst estimates but was down 5% year-over-year. Total costs and operating expenses amounted to $1.01 billion. Higher infrastructure investments and a decline in non-GAAP operating income year-over-year have impacted the bottom line, which could be a source of investor concern.
- Increased Capital Expenditure and Convertible Senior Notes: Capital expenditures were $464 million in Q3, or 41% of revenue, and are projected to significantly increase in Q4 (approximately $2.445-$2.645 billion) due to pre-purchases of critical supply chain components. This substantial investment, along with the recent offering of $2.6 billion in convertible senior notes (totaling $3.5 billion completed offering), introduces concerns about funding, potential share dilution upon conversion, and short-term margin pressure, contributing to stock price fluctuations.
- Mixed Outlook and Analyst Scrutiny: While the overall 2027 outlook for accelerating revenue growth is positive, some near-term projections, such as Q4 revenue outlook being less than expected due to delays and Q4 EPS guidance being below the year-ago quarter, have likely contributed to volatility. Analysts are closely scrutinizing execution risks, contract economics, and the credibility of the long-term CIS outlook, leading to differing investor reactions.
|
|
Revenue
$1.12B
|
|
Net Income
$117M
|
|
Net Margin
10.44%
|
|
🔍 Deep Dive: HOST HOTELS & RESORTS, INC.
Period Ending 2026-09-30
|
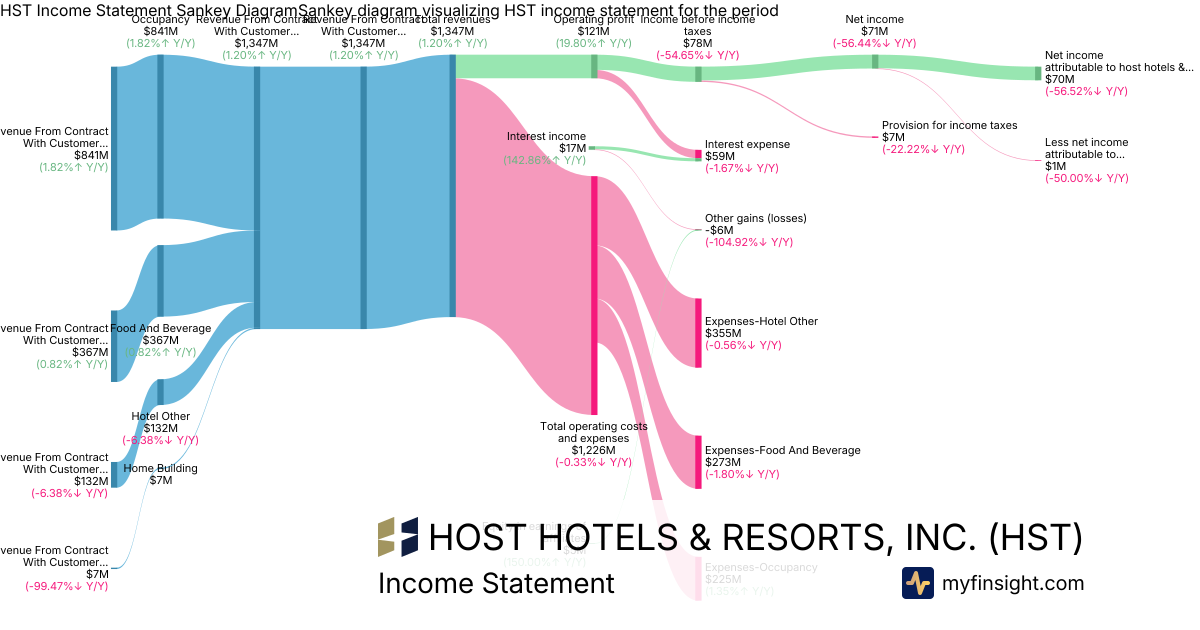
- Strong Q3 Financial Outperformance and Raised Full-Year Guidance: Host Hotels & Resorts exceeded expectations with Q3 2026 adjusted EBITDAre of $347 million (up 8.8% year-over-year) and adjusted FFO per share of $0.39 (up 11.4%). This strong performance led to an upward revision of full-year 2026 adjusted EBITDAre guidance by $35 million to $1.865 billion.
- Robust RevPAR Growth Driven by Broad-Based Demand: Comparable hotel RevPAR increased 8.8% to $219.50, fueled by a 12% surge in transient revenue and strong performance across leisure, group, and business transient segments. The company reported RevPAR gains in 23 of 24 domestic markets.
- Strategic Portfolio Enhancements through Acquisitions: Host completed two accretive acquisitions, including the 1 Hotel Brooklyn Bridge for $202 million and the Renaissance Dallas at Plano Legacy West for $172 million. These investments are anticipated to contribute $6 million of EBITDA in 2026 and nearly complete the reinvestment of proceeds from prior asset sales.
- Improved Margins Despite Wage Pressures: Comparable hotel EBITDA margin expanded 90 basis points to 25.2% in Q3, as rate growth more than offset a projected 5% full-year increase in wage rates. The company expects its full-year comparable hotel EBITDA margin to reach approximately 30%.
- Cautionary Note on GAAP Net Income and Weather Impacts: Despite strong operational performance, GAAP net income fell significantly by 56.4% to $71 million, primarily reflecting a decline in gains on asset sales. Additionally, Hawaii weather events are expected to reduce full-year EBITDA by approximately $10 million.
Overall Takeaway
The Q3 2026 earnings call for Host Hotels & Resorts was broadly positive. The company demonstrated strong operational momentum with key metrics exceeding expectations, driven by robust demand across all segments. The proactive strategic acquisitions and raised full-year guidance further reinforce a positive outlook, although investors should note the decline in GAAP net income due to non-operating factors.
|
|
Revenue
$1.35B
|
|
Net Income
$70M
|
|
Net Margin
5.20%
|
|
🔍 Deep Dive: AXON ENTERPRISE, INC.
Period Ending 2026-09-30
|
|
🚨 Price Alert: The stock price dropped by 28.55% around the earning call.
|
AXON's stock has experienced notable price fluctuations around its recent earnings call, primarily driven by a mixed financial performance, where robust revenue growth and healthy gross margins were balanced against significant operating expenses and a substantial long-term debt burden. Recent reports indicate that the volatility was also fueled by a miss on Wall Street's expectations for both revenue and non-GAAP EPS, a trim to the full-year growth outlook due to federal contract delays, and a decline in gross margin.
Key Factors Contributing to Volatility:
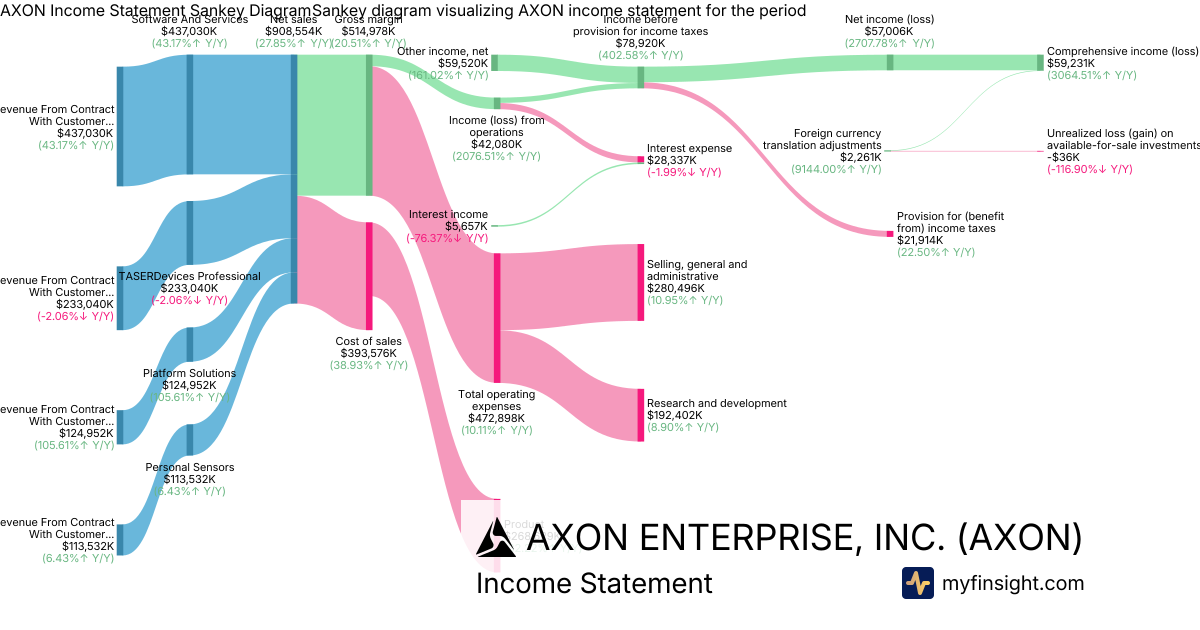
- Robust Net Sales: AXON reported impressive net sales of $909 million for Q3 2026, marking a 27.8% year-over-year increase, indicating strong market demand for its products and services.
- Decline in Gross Margin: Despite strong revenues, the total company gross margin declined to 56.7% from 60.1% in the prior-year period. This decrease was primarily attributed to an increased mix of lower-margin counter-drone equipment, higher memory costs, and the scaling of new product categories.
- Significant Operating Expenses: Total operating expenses reached $473 million, including $192 million in Research and Development and $280 million in Selling, General and Administrative expenses, which impacted the operating income of $42.1 million.
- Federal Contract Delays: A notable trim to Axon's full-year growth outlook, due to approximately $130 million in expected revenue from three delayed federal Dedrone deployments, significantly spooked investors and contributed to the stock's downturn.
- Substantial Long-Term Debt and Strategic Investments: The company carries a significant long-term notes payable balance of $2.87 billion. Additionally, a $1.2 billion investment in Skydio, increasing Axon's ownership stake to 37%, while strategically sound, is capital-intensive and occurred at a time when free cash flow was already being trimmed.
|
|
Revenue
$909M
|
|
Net Income
$59.2M
|
|
Net Margin
6.52%
|
|
🔍 Deep Dive: METLIFE INC
Period Ending 2026-09-30
|
- Record Earnings and Strong Growth: MetLife reported its highest quarterly adjusted EPS in company history at $2.85, excluding notable items, an increase of 22% year-over-year. Adjusted earnings rose 17% to $1.8 billion, driven by higher variable investment income, broad-based volume growth, and favorable underwriting. Net income increased 187% to $2.4 billion, largely due to a non-economic accounting gain from rising interest rates.
- Broad-Based Segment Performance: All business segments contributed to revenue growth, with Retirement and Income Solutions (RIS) earnings up 12% to $478 million, driven by higher investment margins and volume growth. Asia adjusted earnings rose 21% on a constant currency basis to $550 million, benefiting from favorable equity markets and Variable Investment Income (VII). EMEA earnings jumped 30% to $114 million on volume growth.
- Robust Capital Management and Shareholder Returns: MetLife repurchased $650 million in shares during Q3, with year-to-date capital returned to shareholders reaching approximately $3.5 billion, including dividends. The company maintained holding company cash and liquid assets at $3.4 billion, within its target buffer.
- Positive Outlook and Reaffirmed Guidance: Management expects full-year RIS adjusted earnings to be slightly above the midpoint of its $1.6 billion-$1.8 billion range. Full-year VII is anticipated to exceed the approximately $1.6 billion guidance, with a Q4 assumption at a normal $400 million run rate. The direct expense ratio is on track to beat the 12.1% full-year target, and the long-term 2029 target of 11.3% was reaffirmed.
- Confidence in "New Frontier" Strategy: CEO Michel Khalaf highlighted the quarter as evidence of the strength of the "New Frontier" strategy and disciplined execution, emphasizing the diversified growth model, solid underwriting, and higher investment returns as key drivers of performance.
Overall Takeaway
The Q3 2026 earnings call for MetLife (MET) was broadly positive. The company achieved record adjusted earnings per share, demonstrating strong financial performance across all business segments and effectively managing capital through significant shareholder returns. Positive guidance updates and management's confidence in its strategic initiatives further underscore a favorable outlook for future performance.
|
|
Revenue
$20.5B
|
|
Net Income
$2.35B
|
|
Net Margin
11.46%
|
|
🔍 Deep Dive: SIMON PROPERTY GROUP INC.
Period Ending 2026-09-30
|
- Strong Operational Performance and Exceeded Expectations: Simon Property Group delivered third-quarter 2026 FFO of $3.37 per share, beating the Zacks Consensus Estimate, and reported total revenues of $1.81 billion, surpassing the consensus mark by 4.9%. This robust performance was driven by continued leasing momentum, higher rents, and an increase in occupancy at U.S. Malls and Premium Outlets to 96.5%, tying for the highest combined level since 2016.
- Raised Full-Year Guidance and Dividend Increase: Management raised its full-year 2026 Real Estate FFO outlook to $13.30-$13.40 per share, representing a $0.10 increase at the midpoint from previous guidance, and exceeding the consensus estimate. The company also declared a quarterly common stock dividend of $2.30 per share for the fourth quarter, marking a 4.5% year-over-year increase.
- Impact of Unrealized Losses on Net Income: Net income attributable to common stockholders for the quarter decreased to $499 million, down from $606.2 million in the prior year. This was significantly impacted by a $130 million unrealized loss stemming from the fair value of publicly traded equity instruments and derivative instruments.
- Higher Interest Expense Amidst Debt Market Activity: Interest expense increased to $288 million, up from $243 million in the prior year, reflecting the rising cost of debt. During the quarter, the company issued $800 million in senior notes and closed seven secured loan transactions totaling approximately $970 million, with a substantial portion of its liabilities consisting of $28.4 billion in mortgages and unsecured indebtedness.
- Strong Liquidity and Shareholder Returns: SPG maintained robust liquidity of approximately $9 billion at quarter-end, comprising $570 million in cash (including its share of joint venture cash) and $7.7 billion in available revolving credit capacity. The company also actively returned capital to shareholders by repurchasing approximately 1.14 million shares of its common stock for $236.5 million during the quarter.
Overall Takeaway
The Q3 2026 earnings call for SPG was broadly positive. The company showcased strong underlying operational performance with better-than-expected revenues and FFO, driven by robust leasing activity and increased occupancy. The upward revision of full-year guidance and an increased dividend signal management's confidence in future performance. While net income was tempered by unrealized investment losses and a higher interest expense, the company's solid liquidity and ongoing share repurchases highlight its financial strength and commitment to shareholder value.
|
|
Revenue
$1.81B
|
|
Net Income
$499M
|
|
Net Margin
27.50%
|
|
🔍 Deep Dive: METTLER TOLEDO INTERNATIONAL INC/
Period Ending 2026-09-30
|
|
Revenue
$1.09B
|
|
Net Income
$246M
|
|
Net Margin
22.48%
|
|
🔍 Deep Dive: BXP, Inc.
Period Ending 2026-09-30
|
|
Revenue
$911M
|
|
Net Income
$114M
|
|
Net Margin
12.56%
|
|
🔍 Deep Dive: CAMDEN PROPERTY TRUST
Period Ending 2026-09-30
|
|
Revenue
$4.38M
|
|
Net Income
$900M
|
|
Net Margin
20570.96%
|
|
🔍 Deep Dive: MCDONALDS CORP
Period Ending 2026-09-30
|
|
🚨 Price Alert: The stock price jumped by 7.44% around the earning call.
|
|
Revenue
$7.16B
|
|
Net Income
$2.49B
|
|
Net Margin
34.74%
|
|
🔍 Deep Dive: REGENCY CENTERS CORP
Period Ending 2026-09-30
|
|
Revenue
$419M
|
|
Net Income
$75.1M
|
|
Net Margin
17.93%
|
|
🔍 Deep Dive: JACK HENRY & ASSOCIATES INC
Period Ending 2026-09-30
|
|
🚨 Price Alert: The stock price jumped by 8.53% around the earning call.
|
|
Revenue
$702M
|
|
Net Income
$160M
|
|
Net Margin
22.87%
|
|
🔍 Deep Dive: EVERSOURCE ENERGY
Period Ending 2026-09-30
|
|
Revenue
$2.98B
|
|
Net Income
$346M
|
|
Net Margin
11.62%
|
|
🔍 Deep Dive: HUMANA INC
Period Ending 2026-09-30
|
|
Revenue
$41.2B
|
|
Net Income
$162M
|
|
Net Margin
0.39%
|
|
🔍 Deep Dive: AMEREN CORP
Period Ending 2026-09-30
|
|
Revenue
$2.88B
|
|
Net Income
$676M
|
|
Net Margin
23.46%
|
|
🔍 Deep Dive: YUM BRANDS INC
Period Ending 2026-09-30
|
|
Revenue
$2.05B
|
|
Net Income
$1.62B
|
|
Net Margin
79.02%
|
|
🔍 Deep Dive: Ares Management Corp
Period Ending 2026-09-30
|
|
Revenue
$1.43B
|
|
Net Income
$60M
|
|
Net Margin
4.19%
|
|
🔍 Deep Dive: Blackstone Inc.
Period Ending 2026-09-30
|
|
Revenue
$3.06B
|
|
Net Income
$662M
|
|
Net Margin
21.63%
|
|
🔍 Deep Dive: UNIVERSAL HEALTH SERVICES INC
Period Ending 2026-09-30
|
|
🚨 Price Alert: The stock price jumped by 10.70% around the earning call.
|
|
Revenue
$4.73B
|
|
Net Income
$309M
|
|
Net Margin
6.52%
|
|
🔍 Deep Dive: SCHWAB CHARLES CORP
Period Ending 2026-09-30
|
|
Revenue
$7.17B
|
|
Net Income
$2.81B
|
|
Net Margin
39.20%
|
|
🔍 Deep Dive: BIO-TECHNE Corp
Period Ending 2026-09-30
|
|
Revenue
$300M
|
|
Net Income
$27.7M
|
|
Net Margin
9.23%
|
|
🔍 Deep Dive: O REILLY AUTOMOTIVE INC
Period Ending 2026-09-30
|
|
Revenue
$5.12B
|
|
Net Income
$786M
|
|
Net Margin
15.34%
|
|
This newsletter is sent from
MyFinsight.com.
Was this email forwarded to you? Sign up here.
Unsubscribe
Copyright © 2026 MyFinsight, All rights reserved.
|