🚨 PLUG POWER INC, 🚨 Trade Desk, Inc., 🔗 MARA Holdings, Inc., 🚨 Archer Aviation Inc., 🚨 Skydance Corp

|

|
|
Daily Summary
|
November 09, 2026
|
Welcome to your daily digest. Today we are analyzing the latest income statements and filings from:
|
|
|
|
🔍 Deep Dive: PLUG POWER INC
Period Ending 2026-09-30
|
|
🚨 Price Alert: The stock price jumped by 9.89% around the earning call.
|
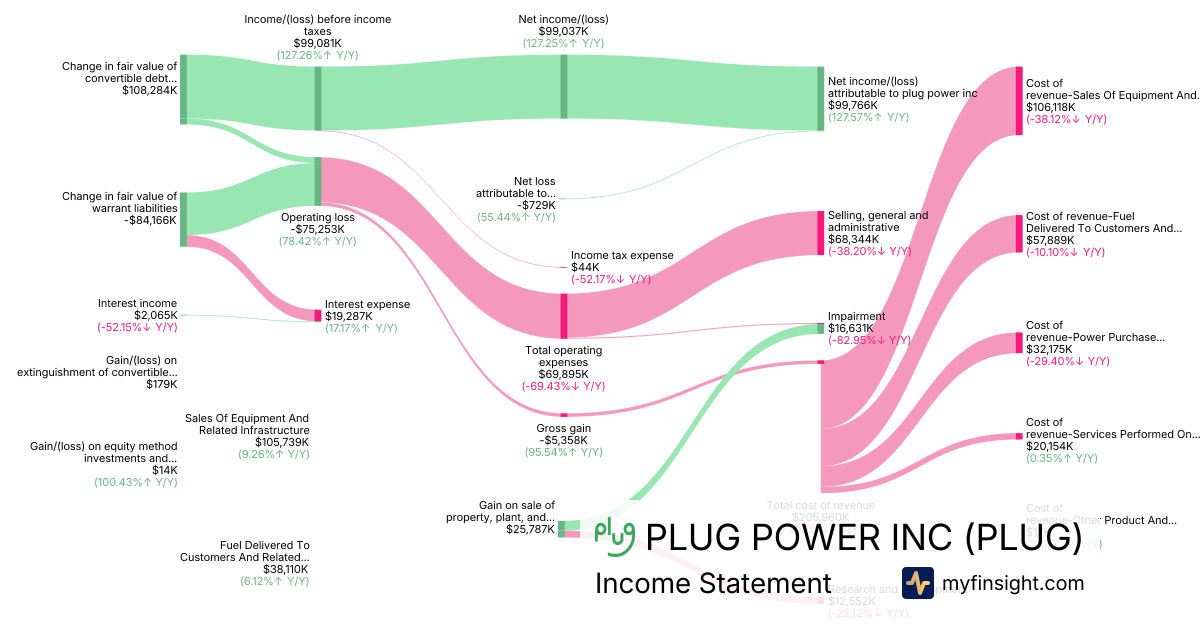
The recent violent price fluctuations experienced by Plug Power (PLUG) around its earnings call can be primarily attributed to a mixed financial performance, characterized by persistent operational losses despite revenue growth, significantly influenced by volatile non-operating gains and losses from financial instruments. This scenario often creates investor uncertainty regarding the company's path to sustainable profitability within the evolving hydrogen economy.
Key Factors Contributing to Volatility:
- Mixed Q3 Financial Results and Operational Challenges: Plug Power reported Q3 2026 revenue of approximately $201 million, exceeding analyst expectations. However, the company still incurred a gross loss of -$5.36 million (or -3% gross margin) and an operating loss of -$75.3 million, despite year-over-year gross margin improvement and significantly reduced operating expenses to approximately $70 million. This discrepancy between top-line growth and persistent operational losses contributes to investor uncertainty.
- Volatile Non-Cash Gains Masking Operational Losses: The reported net income of $99.8 million was primarily driven by significant non-cash fair value gains of $108 million on convertible debt instruments and a negative change in fair value of warrant liabilities of -$84.2 million. These non-operating, non-cash items can lead to dramatic swings in reported profitability and stock price given their often unpredictable nature.
- Improved Cash Management but Lingering Profitability Concerns: The company reported a record-low net cash usage of approximately $28 million and maintained cash and cash equivalents of $134 million at quarter-end. While this demonstrates progress in liquidity, the overall business still faces challenges in achieving sustainable operational profitability, with its Price-to-Sales ratio suggesting tempered future growth expectations from the market.
- Hydrogen Market Dynamics and Long-Term Outlook: As a key player in the hydrogen economy, Plug Power operates in a sector with high growth potential driven by energy transition and decarbonization efforts. However, this market also presents challenges related to infrastructure development, technological maturity, and the long road to widespread profitability for many participants, contributing to investor speculation and price volatility.
- Capital Structure and Future Dilution Potential: The company's capital structure includes significant convertible debt instruments of $471 million and warrant liabilities of $52.1 million. Furthermore, stockholders approved an increase in authorized common shares from 1.5 billion to 3 billion in February 2026, indicating a potential for future dilution, which can impact investor sentiment and stock price.
|
|
Revenue
$201M
|
|
Net Income
$99.8M
|
|
Net Margin
49.73%
|
|
🔍 Deep Dive: Trade Desk, Inc.
Period Ending 2026-09-30
|
|
🚨 Price Alert: The stock price jumped by 21.48% around the earning call.
|
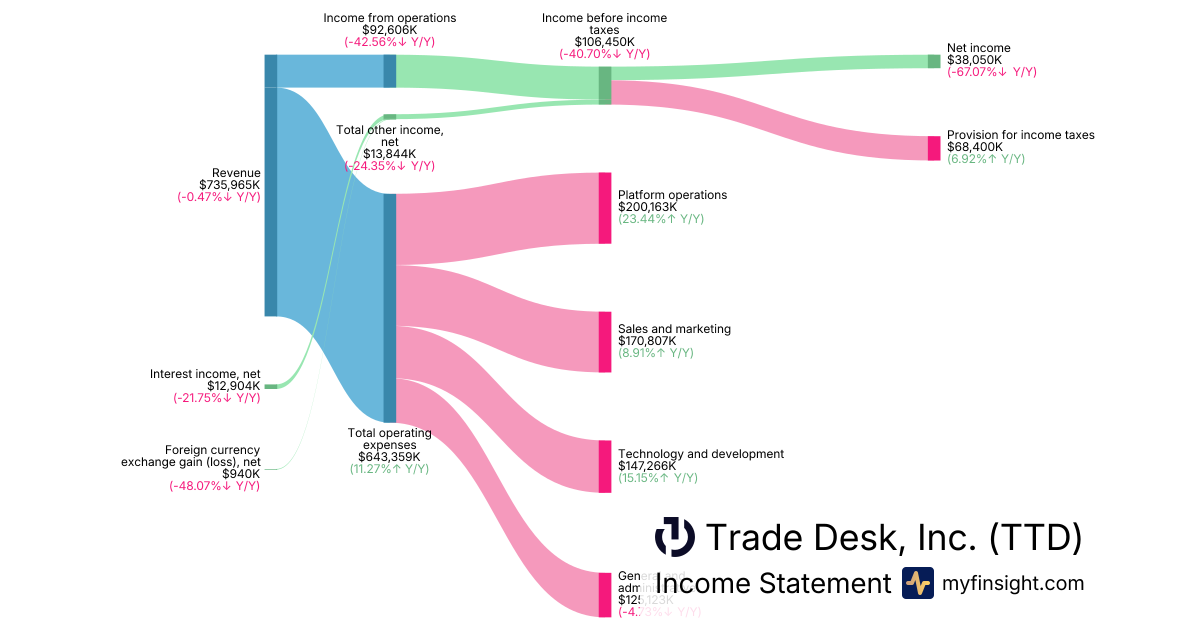
The stock ticker TTD has recently experienced significant price volatility, primarily driven by its third-quarter 2026 earnings report. While the company delivered a robust performance that significantly surpassed analyst expectations, this was set against a backdrop of prior decelerating growth and a substantial undervaluation of its stock, leading to a strong positive market reaction.
Key Factors Contributing to Volatility:
- Strong Q3 Earnings Beat: The Trade Desk reported Q3 revenue of $736 million, comfortably exceeding analyst estimates of $651.4 million, and adjusted earnings per share of $0.33, beating the consensus of $0.25 per share. This strong top-line performance surprised Wall Street, signaling a potential turnaround.
- Profitability Amidst Growth Challenges: Despite a slight year-over-year revenue decline of 0.5% and a decrease in net income to $38 million from $116 million in the prior year, the results were well ahead of the company's and analysts' lowered expectations. The income from operations stood at $92.6 million.
- Positive Future Outlook and Strategic Initiatives: The company provided an optimistic outlook, forecasting Q4 revenue of at least $755 million, surpassing analyst estimates. Continued high customer retention (above 95%) and ongoing investments in product innovation, including AI and connected TV partnerships with platforms like Netflix, also fueled positive sentiment.
- Market Undervaluation and Insider Confidence: Prior to the earnings report, TTD's stock was considered significantly undervalued, trading roughly 85% below its GF Value™. The strong earnings beat, coupled with significant insider buying activity, including CEO stock options, reinforced confidence in the company's prospects and triggered a substantial rebound.
- Robust Balance Sheet and Liquidity: TTD maintains a healthy financial position with cash and cash equivalents of $1.23 billion and accounts receivable of $3.08 billion, contributing to overall financial strength (total assets of $5.95 billion against total liabilities of $3.25 billion). While the high accounts receivable could be a point of scrutiny, the overall liquidity supports the company's operational stability.
|
|
Revenue
$736M
|
|
Net Income
$38M
|
|
Net Margin
5.17%
|
|
🔍 Deep Dive: MARA Holdings, Inc.
Period Ending 2026-09-30
|
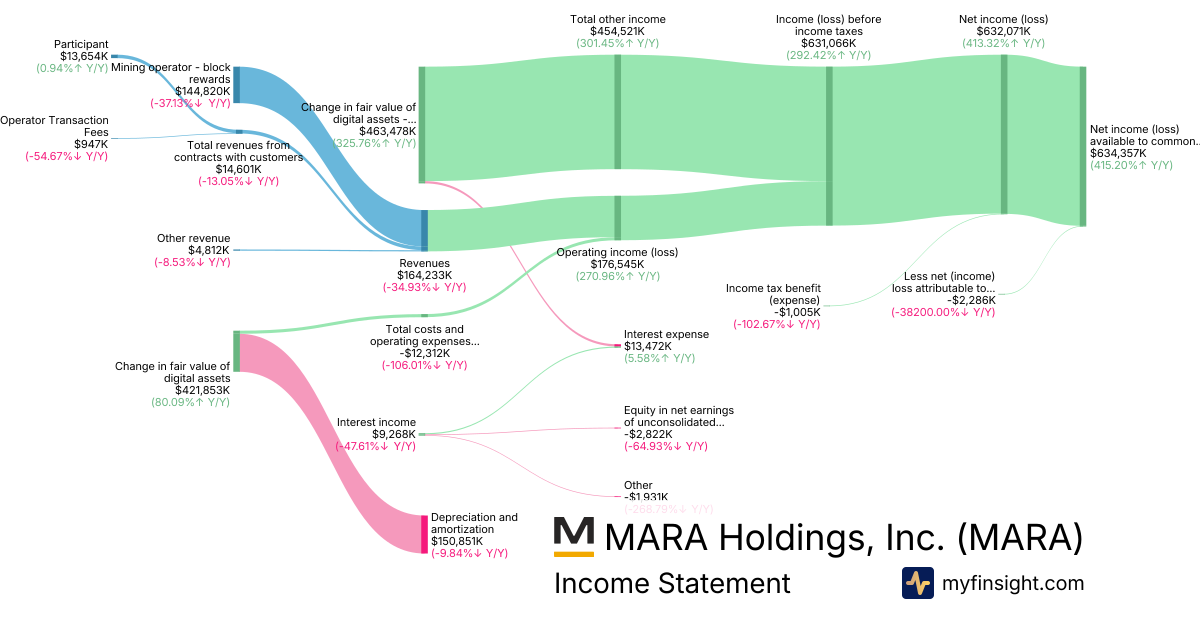
- Strong Net Income Despite Revenue Miss, Driven by Digital Asset Gains: Marathon Digital Holdings reported a substantial net income of $632 million (or $1.28 EPS), significantly exceeding analyst expectations for a loss. However, this was largely attributed to an $885.3 million unrealized non-cash fair value gain on digital assets, while revenue of $164 million missed estimates and declined 35% year-over-year due to lower average Bitcoin prices.
- Strategic Pivot Towards Digital Infrastructure and AI: The company is actively transforming from a pure-play Bitcoin miner into a diversified digital infrastructure operator, focusing on AI and high-performance computing (HPC) data centers. This includes securing rights to significant grid capacity (e.g., 2 GW in Matagorda, Texas) and the recent FERC approval for the Long Ridge natural gas plant acquisition, expected to add substantial annualized Adjusted EBITDA.
- Significant Debt Reduction and Enhanced Liquidity: Marathon aggressively reduced total debt by $1.4 billion, or 37%, since the beginning of 2026. Post-quarter, the sale of 13,597 Bitcoin generated over $1.1 billion, enabling the full repayment of $750 million in Bitcoin-backed loans and releasing collateral. The company maintains strong liquidity with combined cash and Bitcoin holdings of approximately $3.8 billion.
- Operational Growth in Bitcoin Mining and Cost Management: Despite revenue challenges from Bitcoin price, the company increased Bitcoin production to 2,247 in the quarter and boosted energized hashrate by 18% to 71.2 EH/s. Management highlighted a cost per petahash per day improvement of 2% year-over-year.
- Share Repurchase Program and Future Outlook: The Board authorized a new $500 million share repurchase program. While management is progressing with AI/HPC lease discussions, the timing of securing initial major AI data center leases remains a key focus for future performance.
Overall Takeaway
The earnings call was broadly positive, primarily due to the significant net income beat driven by the revaluation of digital assets and the company's aggressive debt reduction efforts. Investors also responded favorably to the strategic pivot towards digital infrastructure and AI, alongside a new share repurchase program. However, the substantial year-over-year revenue decline, primarily influenced by Bitcoin price volatility, suggests that core mining operations faced headwinds, and the future performance is increasingly tied to the successful execution of its diversification strategy beyond pure Bitcoin mining.
|
|
Revenue
$164M
|
|
Net Income
$634M
|
|
Net Margin
386.25%
|
|
🔍 Deep Dive: Archer Aviation Inc.
Period Ending 2026-09-30
|
|
🚨 Price Alert: The stock price jumped by 14.52% around the earning call.
|
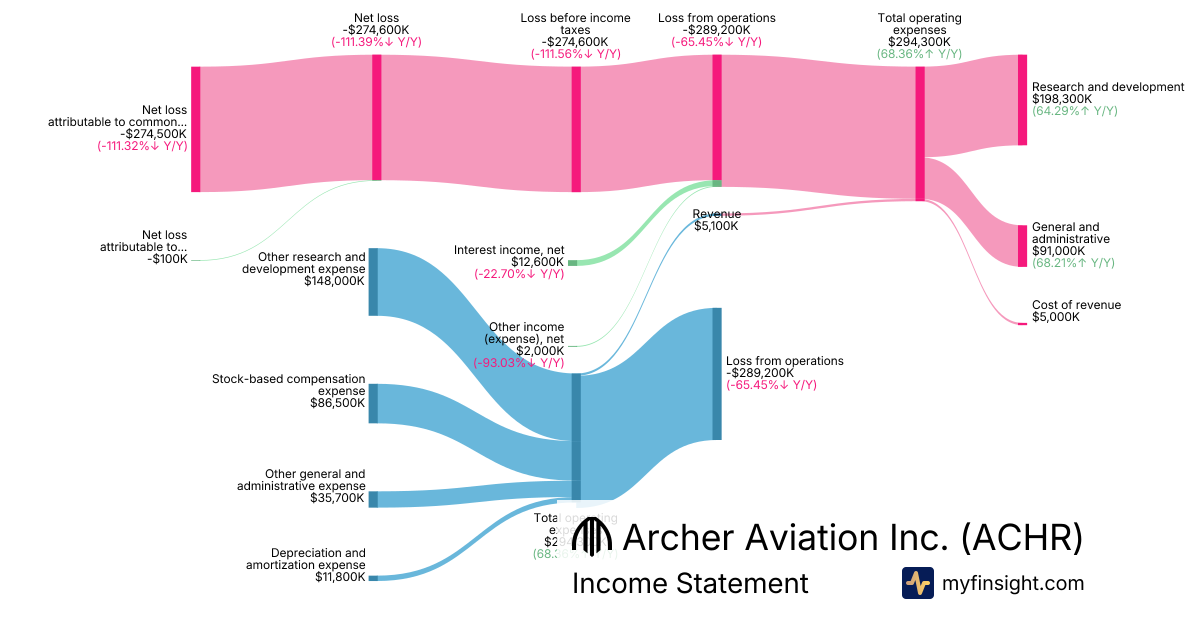
Archer Aviation (ACHR) has recently experienced significant price fluctuations around its Q3 2026 earnings call, driven by a complex interplay of promising operational advancements and persistent financial challenges typical of an early-stage electric vertical takeoff and landing (eVTOL) company. While the company exceeded revenue expectations and made substantial progress in certification and strategic partnerships, it continues to report considerable losses and high operating expenses.
Key Factors Contributing to Volatility:
- Imminent Boeing Acquisition: The impending closure of the acquisition of Boeing's Wisk, Insitu, and SkyGrid businesses is a major catalyst. This deal is expected to close much sooner than year-end, with Insitu alone projected to add over $200 million in annual revenue and positive operating cash flows, significantly boosting Archer's revenue profile and making Boeing its largest shareholder.
- Operational Progress & FAA Certification: Archer received the Federal Aviation Administration's (FAA) Market Survey Special Airworthiness Certificate for its Midnight aircraft, enabling piloted operations in Los Angeles and advancing preparations for passenger services as part of the eIPP and LA28 Olympic Games. The company also completed over 118 flight tests this quarter and began testing a turboshaft engine for its Halo/Thunder hybrid VTOL platform.
- Persistent Losses and High Expenses: Despite a revenue beat, Archer reported a net loss attributable to common stockholders of -$274 million for Q3 2026, and total operating expenses rose to $294 million, reflecting significant investments in flight testing, certification, and production activities.
- Revenue Exceeds Estimates: Archer reported $5.1 million in revenue for Q3 2026, surpassing analyst consensus estimates, driven partly by initial engine deliveries to Anduril. This modest revenue, however, is dwarfed by the company's substantial expenses.
- Cash Position and Future Outlook: The company ended the quarter with a strong liquidity position of approximately $1.46 billion in cash, cash equivalents, and short-term investments, which management believes will fund its current operating plan for at least 12 months. However, Archer anticipates a higher adjusted EBITDA loss for Q4 2026, indicating continued heavy investment in development and commercialization.
|
|
Revenue
$5.1M
|
|
Net Income
-$274M
|
|
Net Margin
-5382.35%
|
|
🔍 Deep Dive: Skydance Corp
Period Ending 2026-09-30
|
|
🚨 Price Alert: The stock price jumped by 9.43% around the earning call.
|
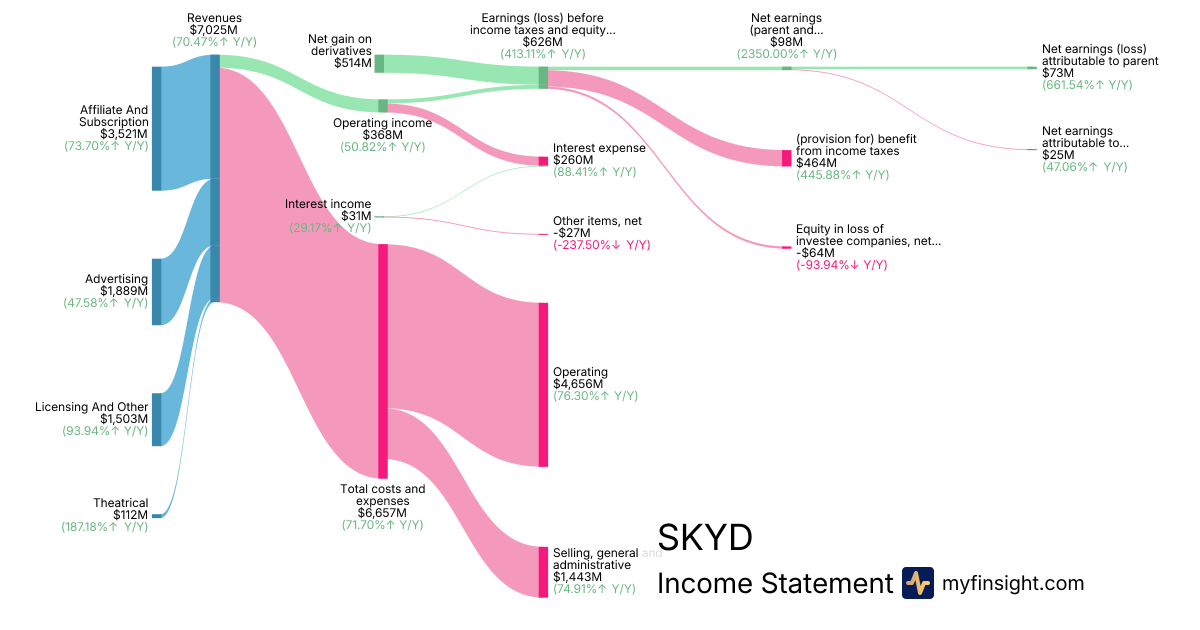
Skydance (SKYD) has experienced significant price fluctuations around its recent earnings call, primarily driven by a complex interplay of post-acquisition integration challenges, mixed segment performance, and a cautious market sentiment regarding its financial structure. The company's Q3 2026 earnings report was its first since the acquisition of Warner Bros. Discovery in 2025, and the reported numbers largely reflected the performance of the pre-merger Paramount Skydance business, leading to investor scrutiny as the market assesses the combined entity's future.
Key Factors Contributing to Volatility:
- Post-Acquisition Integration and Restructuring: The recent acquisition of Warner Bros. Discovery has led to significant strategic adjustments, including substantial restructuring and transaction-related items totaling $187 million, as well as layoffs in the video games division aimed at optimizing costs and integrating assets efficiently. These efforts, while intended to achieve $6 billion in annualized run-rate synergies within three years, create near-term uncertainty that impacts investor confidence.
- Mixed Segment Performance Despite Revenue Growth: Skydance reported total revenues of $7.03 billion, representing a 5% year-over-year increase. However, this growth was mixed, with Studios revenue surging 23% and Direct-to-Consumer business revenue increasing 11%, while TV media revenue declined by 7%. This divergence suggests a challenging transition within core business segments.
- Non-Operating Items Influencing Net Earnings: The reported net earnings attributable to the parent of $73 million were significantly bolstered by a substantial net gain on derivatives of $514 million and a considerable benefit from income taxes of $464 million. Investors are likely scrutinizing the sustainability of these non-recurring items when evaluating core operational profitability.
- High Debt Load and Market Skepticism: The company carries a significant debt burden, with long-term debt reaching $14.4 billion, contributing to a substantial interest expense of $260 million. This, combined with a Price-to-Sales (P/S) ratio of 0.32, which is notably below its historical median and industry average, reflects market skepticism regarding future growth and overall financial strength, especially given the negative trailing twelve months (TTM) EPS.
|
|
Revenue
$7.03B
|
|
Net Income
$73M
|
|
Net Margin
1.04%
|
|
🔍 Deep Dive: AST SpaceMobile, Inc.
Period Ending 2026-09-30
|
|
🚨 Price Alert: The stock price dropped by 9.96% around the earning call.
|
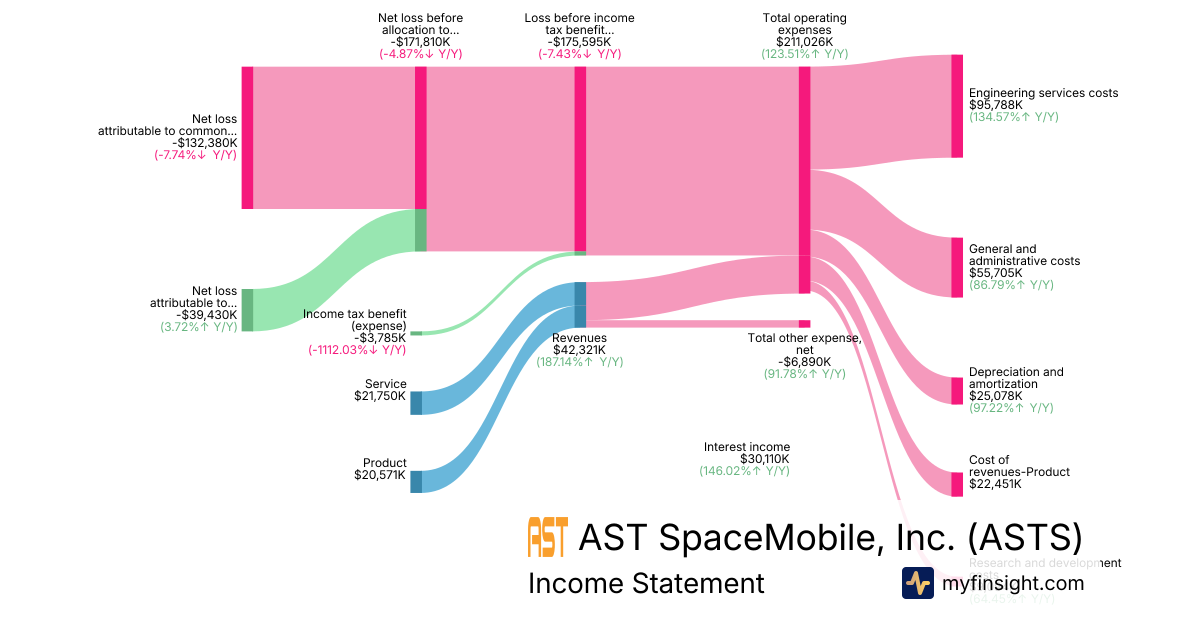
AST SpaceMobile (ASTS) recently experienced significant price fluctuations around its Q3 2026 earnings call on November 9, 2026. Despite reporting a wider net loss and missing analyst estimates for revenue, the stock surged, indicating that investors are primarily focused on the company's operational progress and long-term potential in building a global cellular broadband network in space.
Key Factors Contributing to Volatility:
- Wider Net Loss and Revenue Miss: ASTS reported a net loss attributable to common stockholders of $132.4 million, a widening from the previous year, and quarterly revenue of $42.3 million, which, despite a significant year-over-year increase of 187.3%, fell short of analyst expectations.
- Strong Operational Progress: Investors appear to be buoyed by the company's advancements towards service readiness, including expected initial, intermittent nationwide coverage in key markets by year-end 2026, and the validation of satellite beam handovers with AT&T.
- Accelerated Satellite Production and Technology: ASTS highlighted accelerated satellite production, pulling forward its next-generation ASIC technology to BlueBird 34, which delivers a tenfold improvement in processing bandwidth. The company aims to have approximately 45 satellites in orbit by mid-2027 and over 100 by 2028.
- Robust Funding and Strategic Contracts: The company's strong cash position of over $3.2 billion, boosted by a $1.15 billion convertible notes offering, provides capital for its ambitious plans. Additionally, new contracts, such as a $100 million U.S. Space Force award and a $1 billion J-LEO subsidy from Japan, signal significant future revenue streams.
- Reaffirmed Full-Year Guidance: Management reiterated its full-year 2026 revenue guidance of $150 million to $200 million, with potential for upside, which has likely instilled confidence in the company's future financial trajectory despite current losses.
|
|
Revenue
$42.3M
|
|
Net Income
-$132M
|
|
Net Margin
-312.80%
|
|
🔍 Deep Dive: Surgery Partners, Inc.
Period Ending 2026-09-30
|
|
🚨 Price Alert: The stock price jumped by 13.96% around the earning call.
|
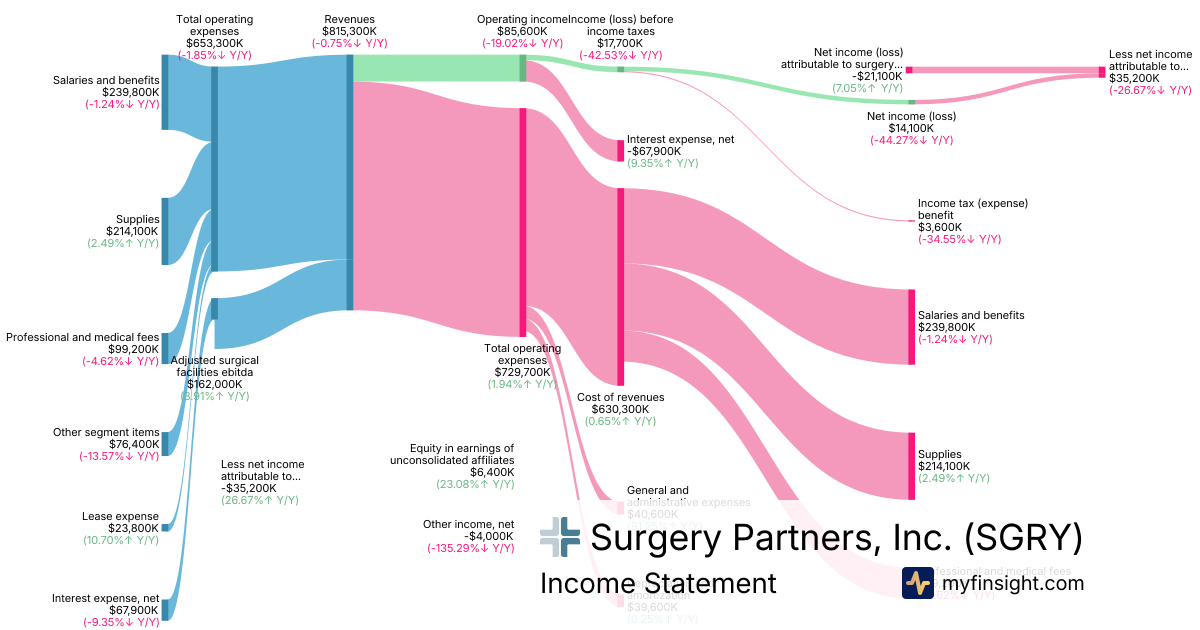
Surgery Partners (SGRY) has experienced significant price fluctuations primarily driven by a dynamic merger agreement, coupled with its recent mixed quarterly earnings and strategic financial maneuvers. The announcement of an increased acquisition offer has significantly impacted market perception and stock movement.
Key Factors Contributing to Volatility:
- Revised Merger Agreement: The primary driver of recent volatility is the amended merger agreement with HealthSpan Partners, which increased the acquisition consideration to $25.00 per share in cash, following an unsolicited competing proposal. This revised offer values Surgery Partners at up to approximately $6.0 billion.
- Mixed Q3 2026 Earnings Performance: For the third quarter of 2026, Surgery Partners reported a narrowed net loss attributable to the company of $21.1 million, and adjusted earnings per share (EPS) of $0.16, beating analyst estimates. However, revenue fell slightly to $815.3 million, missing consensus estimates.
- Strategic Asset Sale and Debt Reduction: The company completed the sale of its Idaho hospital interests for approximately $796.6 million, generating a pretax gain. A portion of these proceeds, $285.0 million, was used to prepay on its term loan, contributing to the management of its substantial long-term debt.
- Shareholder and Regulatory Scrutiny: The pending merger faces scrutiny, with several law firms initiating investigations into the fairness of the acquisition price for shareholders, which could introduce further uncertainty until regulatory and shareholder approvals are secured.
|
|
Revenue
$815M
|
|
Net Income
-$21.1M
|
|
Net Margin
-2.59%
|
|
🔍 Deep Dive: Keurig Dr Pepper Inc.
Period Ending 2026-09-30
|
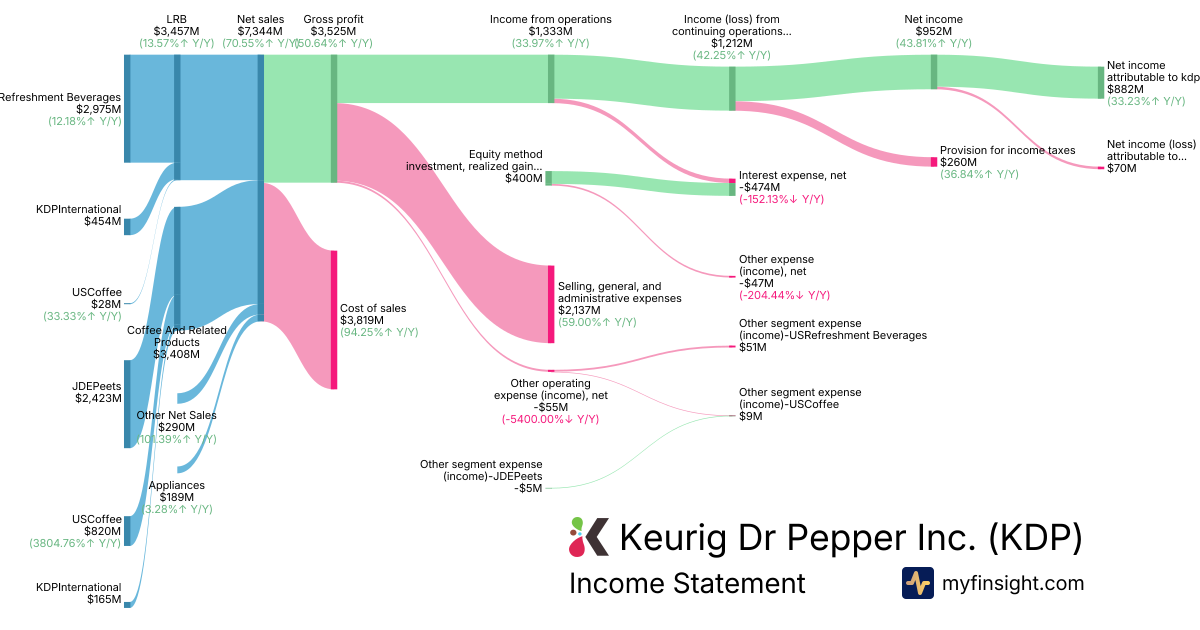
- Robust Net Sales: Keurig Dr Pepper reported significant top-line performance with total Net Sales reaching $7.34 billion.
- Solid Profitability: The company demonstrated strong operational efficiency, achieving a Gross Profit of $3.52 billion and Net Income attributable to KDP of $882 million.
- Healthy Operating Income: Income from operations stood at $1.33 billion, indicating sound core business management.
- Key Segment Contribution: The US Refreshment Beverages segment was a primary revenue driver, contributing $2.98 billion in sales from its LRB (Liquid Refreshment Beverages) category and $3.03 billion in total net sales.
- Financial Position: Keurig Dr Pepper maintained a substantial financial base, reporting total assets of $86.9 billion against total liabilities of $52.8 billion.
Overall Takeaway
Based solely on the provided financial figures, the earnings call for Keurig Dr Pepper appears to be broadly neutral. While the absolute numbers for net sales, gross profit, and net income are substantial, without comparative data (e.g., year-over-year growth, analyst expectations, or management guidance), it is not possible to determine if these results exceeded, met, or fell short of market expectations or prior performance. The figures suggest a stable operational and financial standing.
|
|
Revenue
$7.34B
|
|
Net Income
$882M
|
|
Net Margin
12.01%
|
|
🔍 Deep Dive: TE Connectivity plc
Period Ending 2026-09-25
|
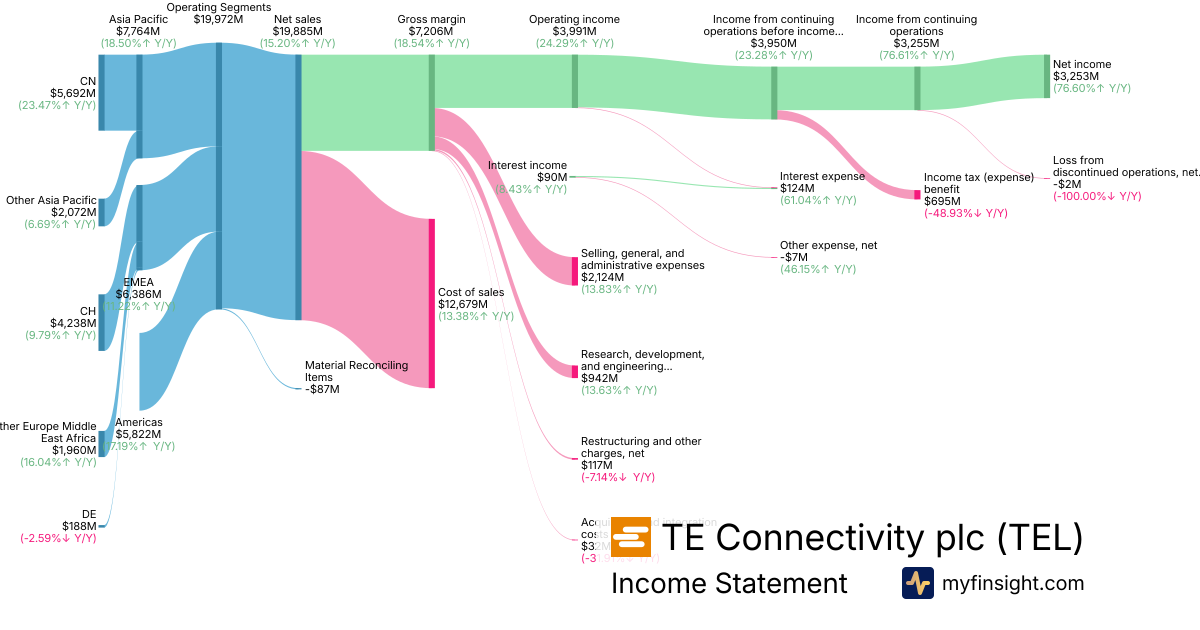
- Record Fiscal Year 2026 Performance: TE Connectivity reported record net sales of $19.9 billion for fiscal year 2026, marking a 15% reported and 12% organic increase year-over-year. This strong top-line performance translated into a gross margin of $7.21 billion, operating income of $3.99 billion, and a net income of $3.25 billion, setting company records for sales, orders, operating margin, EPS, and cash generation.
- Strategic Growth Drivers in Core Segments: The Industrial Solutions segment achieved substantial growth of 26% in 2026, significantly bolstered by increasing demand in Digital Data Networks and energy applications, aligning with accelerating data and power trends. The Transportation Solutions segment also performed robustly, with the Automotive Industry End Market contributing $7.52 billion in revenue despite a challenging global vehicle production environment. Overall, operating segments generated $20 billion in revenue.
- Commitment to Innovation and Portfolio Expansion: The company demonstrated a continued focus on future growth through significant investment in innovation, evidenced by Research, Development, and Engineering expenses of $942 million. Furthermore, TEL committed $1.6 billion towards strategic bolt-on acquisitions within the Industrial segment, aimed at enhancing its optics and power filtering capabilities.
- Solid Financial Position and Shareholder Returns: TE Connectivity maintained a strong financial foundation, reporting total assets of $26.7 billion, including $1.7 billion in cash and cash equivalents, and total shareholders' equity of $13.6 billion. The company also returned approximately $2.8 billion to shareholders during the fiscal year.
- Market Reaction and Future Outlook: Despite surpassing Q4 adjusted EPS expectations and providing Q1 fiscal 2027 guidance for sales of approximately $5.35 billion (up 15% year-over-year), the stock experienced a decline post-report. This reaction was partly attributed to the market perceiving the double-digit growth guidance as a continuation rather than an acceleration of prior year's growth. Management acknowledged persistent macroeconomic headwinds, including inflation in raw materials, freight costs, and currency fluctuations.
Overall Takeaway
The recent earnings call for TE Connectivity (TEL) was broadly positive. The company delivered record financial results for fiscal year 2026, demonstrating robust organic growth driven by strong performance in both its Industrial and Transportation segments, particularly in areas tied to data and power trends. While the market's reaction to the Q1 fiscal 2027 guidance indicated a desire for accelerating growth beyond the already strong performance, the underlying business fundamentals, strategic investments, and shareholder returns highlight a resilient and well-positioned company.
|
|
Revenue
$19.9B
|
|
Net Income
$3.25B
|
|
Net Margin
16.36%
|
|
🔍 Deep Dive: EMERSON ELECTRIC CO
Period Ending 2026-09-30
|
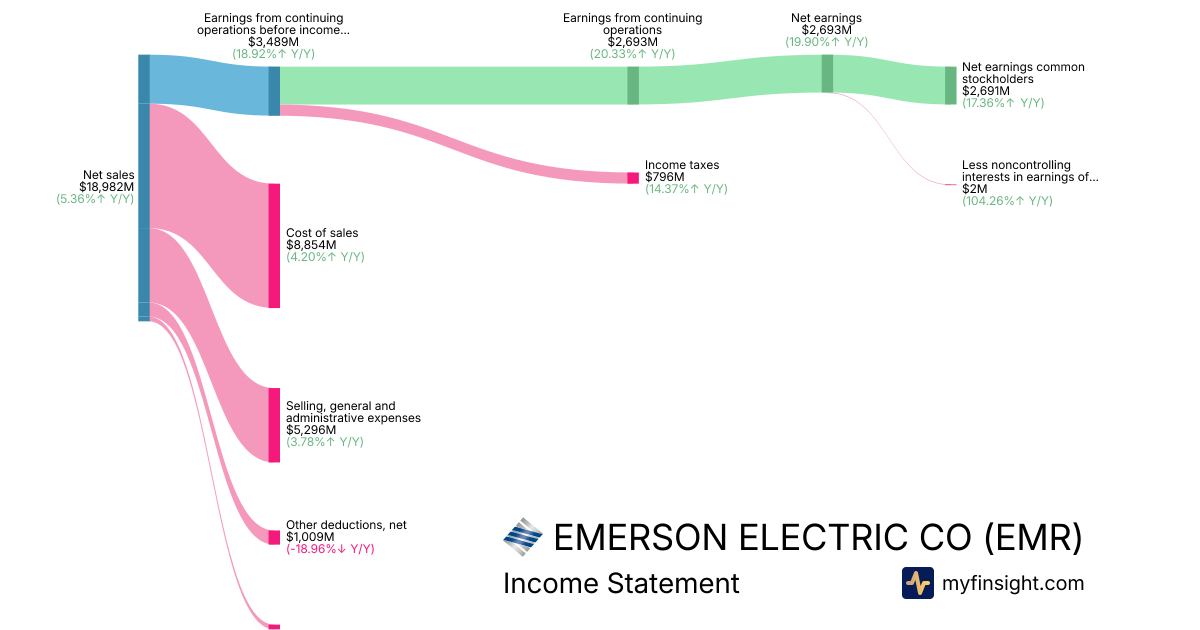
- Strong Q4 Performance and Full-Year Achievements: Emerson exceeded expectations in Q4 2026 with underlying sales growth of 7% and adjusted EPS of $1.86 (up 15% year-over-year). For the full fiscal year 2026, the company reported net sales of $19 billion and delivered an adjusted EPS of $6.59 (up 10%), marking its sixth consecutive year of double-digit adjusted EPS growth.
- Robust Orders and Segment-Led Growth: The company experienced an acceleration in underlying orders, growing 14% in Q4, driven by strong performance in Software & Systems (14% sales growth, 18% order growth) and Intelligent Devices (13% order growth). This strength was particularly notable in North America and the Middle East, contributing to an increased backlog of $8.2 billion, up 11% year-over-year.
- Positive FY2027 Outlook and Capital Allocation: Management provided a strong fiscal 2027 outlook, forecasting approximately 5% underlying sales growth and adjusted EPS of $7.25 (up 10%). Emerson also plans to return substantial capital to shareholders, targeting $3.8 billion in 2027, including $2.5 billion in share repurchases and $1.3 billion in dividends, alongside a 7% dividend increase.
- Operational Efficiency and AspenTech Synergy: Adjusted segment EBITA margins expanded to 29.1% in Q4, demonstrating improved profitability. The company successfully completed the AspenTech integration two years ahead of schedule, realizing $100 million in synergies, which positively impacted financial results. Amortization of intangibles for the period was $816 million.
- Focus on Growth Verticals and Market Trends: Emerson continues to prioritize its growth verticals (power, LNG, life sciences, semiconductor, aerospace & defense), which contributed 27% of sales in fiscal 2026 and saw strong growth (e.g., LNG up 68%, semiconductor up 43% in Q4). Management highlighted secular trends in electrification, energy security, and nearshoring as key drivers for future demand, although acknowledging persistent softness in Europe and China.
Overall Takeaway
The Q4 2026 earnings call for Emerson Electric was broadly positive. The company exceeded expectations with strong quarterly performance, highlighted by significant underlying order growth and margin expansion across its key segments. Management provided an optimistic outlook for fiscal 2027, including robust adjusted EPS growth and a substantial plan for returning capital to shareholders. Strategic initiatives like the early completion of AspenTech integration and continued focus on high-growth verticals further underscore a healthy business trajectory, despite some regional weakness.
|
|
Revenue
$19B
|
|
Net Income
$2.69B
|
|
Net Margin
14.18%
|
|
🔍 Deep Dive: Vistra Corp.
Period Ending 2026-09-30
|
- Record Q3 Performance and Strong Drivers: Vistra Corp. reported a record third-quarter 2026 adjusted EBITDA of $2.38 billion, representing a more than 50% increase year-over-year. This was driven by higher realized power prices, increased capacity revenue, fleet dispatch optimization, and contributions from recent acquisitions. The company also reported a GAAP net income of $1.14 billion for the quarter.
- Raised 2026 and Robust 2027 Guidance: The company narrowed its full-year 2026 adjusted EBITDA guidance to $7.1–$7.5 billion and adjusted free cash flow before growth to $4.3–$4.7 billion, with both ranges reflecting higher midpoints than originally projected. For 2027, Vistra introduced guidance of $7.7–$8.5 billion adjusted EBITDA and $4.3–$5.1 billion adjusted free cash flow before growth, with long-term adjusted free cash flow before growth per share projected at approximately $14 in 2027 and ~$24 in 2030.
- Strategic Acquisition and Portfolio Expansion: Vistra successfully closed the Cogentrix acquisition, adding approximately 5,500 MW of natural gas-fueled generation capacity for a net purchase price of about $4 billion. This acquisition is expected to deliver high single-digit adjusted free cash flow accretion near-term, increasing to double-digit accretion starting in 2029.
- Significant Capital Returns and Improved Metrics: Vistra repurchased approximately $1 billion in shares year-to-date through November 2, 2026, and the board authorized an additional $1.5 billion, bringing the total remaining authorization to approximately $2.5 billion, expected to be utilized by the end of 2028. The company also targets at least $300 million in annual dividends and achieved investment-grade credit ratings with a pro forma net debt to adjusted EBITDA of approximately 2.8 times.
- Growth Drivers and Demand Outlook: Management highlighted that multi-year profitability is supported by structurally improved demand from industrial activity and data centers. However, the company also addressed potential risks such as slower data-center connections in Texas and regulatory uncertainty impacting project timing.
Overall Takeaway
The Q3 2026 earnings call for Vistra (VST) was broadly positive. The company delivered record financial results, significantly raised its 2026 guidance, and provided a strong outlook for 2027 and beyond, supported by strategic acquisitions and robust capital return plans. While some risks related to demand timing and regulatory environment were noted, the overall message conveyed strong operational performance and confidence in future growth.
|
|
Revenue
$6.35B
|
|
Net Income
$1.09B
|
|
Net Margin
17.20%
|
|
🔍 Deep Dive: Constellation Energy Corp
Period Ending 2026-09-30
|
|
Revenue
$9.55B
|
|
Net Income
$1.83B
|
|
Net Margin
19.21%
|
|
🔍 Deep Dive: TAKE TWO INTERACTIVE SOFTWARE INC
Period Ending 2026-09-30
|
|
🚨 Price Alert: The stock price jumped by 9.06% around the earning call.
|
|
Revenue
$1.5B
|
|
Net Income
-$54M
|
|
Net Margin
-3.61%
|
|
🔍 Deep Dive: NRG ENERGY, INC.
Period Ending 2026-09-30
|
|
Revenue
$9.47B
|
|
Net Income
$544M
|
|
Net Margin
5.75%
|
|
🔍 Deep Dive: VIVMARK RESIDENTIAL
Period Ending 2026-09-30
|
|
🚨 Price Alert: The stock price jumped by 6.85% around the earning call.
|
|
Revenue
$1.2B
|
|
Net Income
-$736M
|
|
Net Margin
-61.52%
|
|
This newsletter is sent from
MyFinsight.com.
Was this email forwarded to you? Sign up here.
Unsubscribe
Copyright © 2026 MyFinsight, All rights reserved.
|