🚨 CoreWeave, Inc., 🔗 Ondas Inc., 🚨 Corteva, Inc., 🔗 USA Rare Earth, Inc., 🔗 Forgent Power Solutions, Inc.

|

|
|
Daily Summary
|
November 12, 2026
|
Welcome to your daily digest. Today we are analyzing the latest income statements and filings from:
|
|
|
|
🔍 Deep Dive: CoreWeave, Inc.
Period Ending 2026-09-30
|
|
🚨 Price Alert: The stock price jumped by 16.89% around the earning call.
|
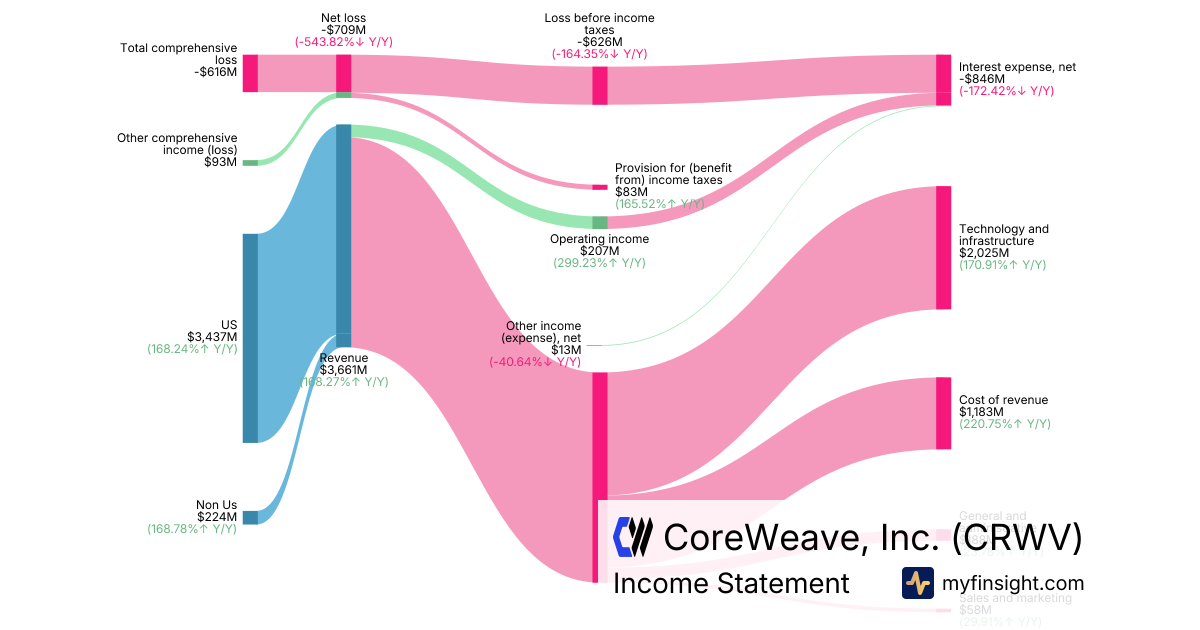
CoreWeave (CRWV) has experienced significant price volatility, particularly around its recent earnings call, driven by a combination of impressive revenue growth fueled by insatiable AI demand and substantial financial challenges related to high operating costs and a rapidly expanding debt load.
Key Factors Contributing to Volatility:
- Explosive Revenue Growth from AI Demand: CoreWeave reported record third-quarter 2026 revenue of $3.66 billion, marking a 168% year-over-year increase and surpassing analyst estimates, primarily due to surging demand for AI compute infrastructure. This growth is underscored by a robust backlog of $132.5 billion.
- Persistent Net Losses and High Expenses: Despite strong top-line performance, the company continues to incur significant net losses, reporting a net loss of -$709 million for Q3 2026. This is largely attributed to substantial technology and infrastructure costs of $2.02 billion and a considerable net interest expense of -$846 million.
- Mounting Debt Load for Infrastructure Expansion: CoreWeave's aggressive expansion of its AI data center infrastructure is heavily financed by debt, with its net debt reportedly surging to $42.7 billion. This includes significant non-current recourse debt of $32.4 billion and $9.18 billion in current recourse debt, raising investor concerns about financing costs and overall financial health.
- Broader Market and Regulatory Uncertainty: The "neocloud rout" and general investor anxiety about AI capital expenditure, coupled with potential regulatory shifts concerning data center development (such as those discussed in Texas), have added to market uncertainty and pressured the stock.
- High Implied Volatility and Conflicting Analyst Sentiment: Options markets anticipated an approximately 21% post-earnings price swing, indicating high implied volatility. While the company exceeded some analyst estimates, there have been recent price target cuts from various analysts, reflecting a cautious sentiment and the stock's inherent risk-reward profile, contributing to sharp price movements.
|
|
Revenue
$3.66B
|
|
Net Income
-$616M
|
|
Net Margin
-16.83%
|
|
🔍 Deep Dive: Ondas Inc.
Period Ending 2026-09-30
|
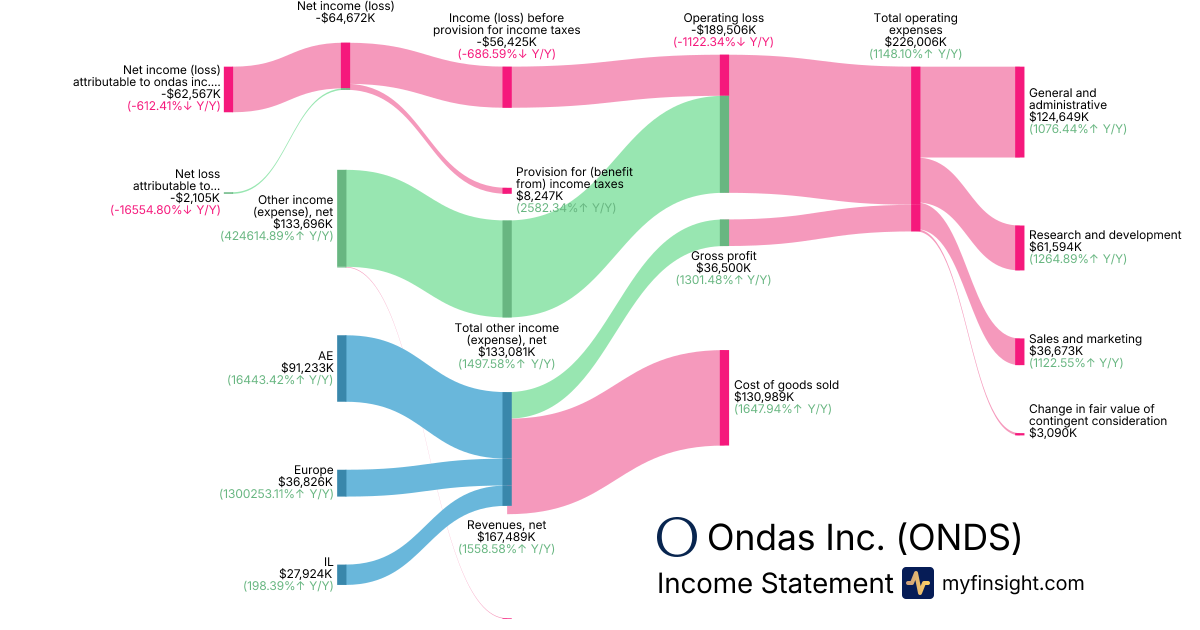
- Record Revenue Performance: Ondas achieved record third-quarter 2026 net revenues of $167 million, demonstrating more than 16-fold year-over-year growth and a 100% sequential increase, fueled by both strategic acquisitions and 64% pro forma organic growth.
- Adjusted Profitability Challenges: Despite strong revenue growth, the company reported a GAAP operating loss of -$190 million and a net loss of -$64.7 million. The adjusted EBITDA loss widened to $59.7 million, with adjusted gross margin at 34.8%, reflecting sequential pressure due to product mix and temporary production inefficiencies.
- Positive Future Guidance and Accelerated Profitability Target: Management raised its full-year 2026 revenue guidance to at least $550 million and initiated an ambitious 2027 revenue target of at least $1.1 billion. The company also pulled forward its company-wide adjusted EBITDA break-even target to Q3 2027 from Q4 2027.
- Strategic Investments and Growth Drivers: Ondas is integrating recent acquisitions to build a scaled operating platform, which contributed to new orders totaling $214 million and a surging backlog of approximately $835 million. Key growth platforms highlighted include ULTRA, a low-cost, long-endurance ISR drone, and IonStrike, a kinetic counter-UAS interceptor, alongside the launch of Regna AI in partnership with NVIDIA and Palantir.
- Robust Liquidity: The company maintained a strong liquidity position, ending the quarter with approximately $263 million in cash and cash equivalents and approximately $526 million in short-term investments, totaling around $820 million in combined liquid assets, despite deploying $431 million for acquisitions during the period.
Overall Takeaway
The Q3 2026 earnings call for ONDS was broadly positive. While the company reported significant GAAP operating and net losses, and faced gross margin pressure from product mix, it showcased record revenue growth, robust organic expansion, and a substantial increase in its order backlog. Management provided strong future revenue guidance for 2026 and 2027, and notably accelerated its target for company-wide adjusted EBITDA profitability to Q3 2027. Strategic investments in acquisitions and new technology platforms like ULTRA, IonStrike, and Regna AI further underscore a strong growth trajectory and future potential. The company's healthy liquidity also provides a solid foundation for continued execution of its growth initiatives.
|
|
Revenue
$167M
|
|
Net Income
-$62.6M
|
|
Net Margin
-37.36%
|
|
🔍 Deep Dive: Corteva, Inc.
Period Ending 2026-09-30
|
|
🚨 Price Alert: The stock price dropped by 25.04% around the earning call.
|
Corteva (CTVA) recently experienced significant stock price volatility around its Q3 2026 earnings call, primarily driven by a substantial net loss, a year-over-year revenue decline, and weaker-than-anticipated market conditions in Brazil. While the company's reported revenue surpassed analyst estimates, the underlying operational challenges, particularly in Latin America, led to a sharp decline in share price and a revised full-year outlook.
Key Factors Contributing to Volatility:
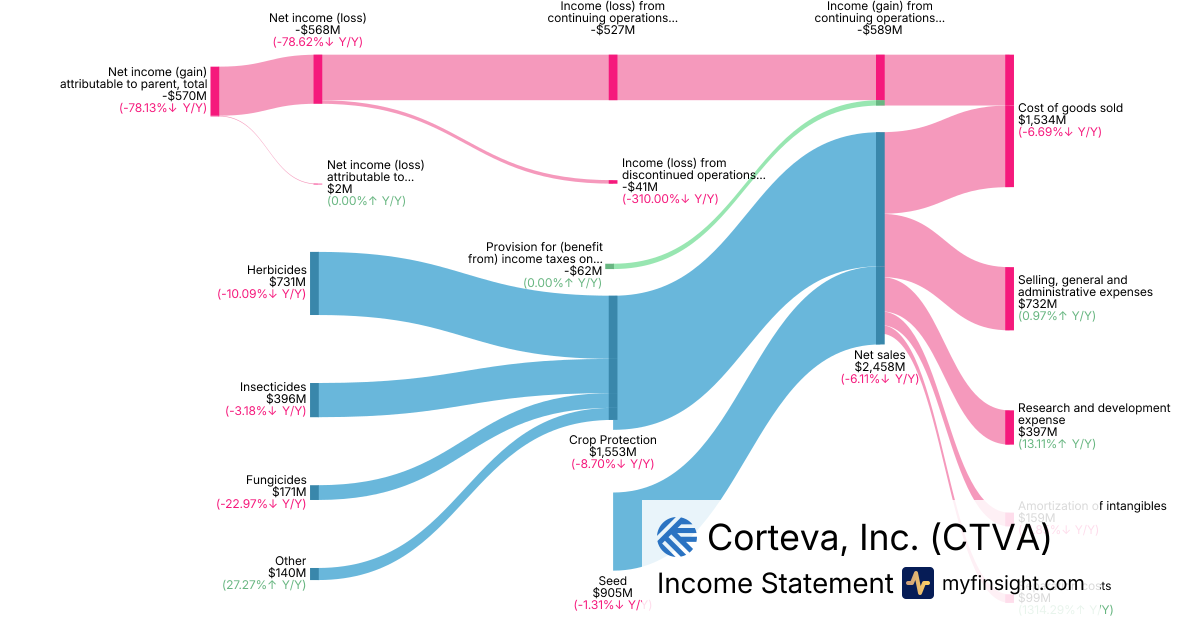
- Significant Net Loss: Corteva reported a net loss attributable to the parent company of
-$570 million for the third quarter of 2026, widening from a loss of $320 million in the prior year. This substantial loss, combined with adjusted earnings per share of $0.06 missing analyst expectations of $0.10, disappointed investors.
- Revenue Decline Driven by Market Challenges: Despite reporting net sales of
$2.46 billion for Q3 2026, which exceeded consensus estimates, this figure still represented an 8.7% decrease year-over-year. The decline was largely attributed to a drop in organic sales due to pricing and volume issues, particularly in Latin America.
- Weakness in Latin American Market: A primary driver of the poor performance was the significant deterioration of market conditions in Brazil and the broader Latin American region, leading to a 31% organic sales decline in Latin America. This was due to competitive pricing pressure from generics, elevated channel inventories, high interest rates, financial constraints for farmers, and adverse weather conditions like El Nino.
- Intense Pricing Headwinds: The company faced considerable pricing pressure, particularly in Brazil on mature crop protection molecules and for acetochlor in the U.S. This was a significant headwind to operating EBITDA, which decreased 17% year over year.
- Revised Full-Year Guidance: Management lowered its full-year 2026 guidance for adjusted pro forma operating EBITDA and operating EPS, reflecting the persistent and weaker-than-anticipated market conditions in Brazil. This downward revision signaled ongoing challenges and further impacted investor confidence.
|
|
Revenue
$2.46B
|
|
Net Income
-$570M
|
|
Net Margin
-23.19%
|
|
🔍 Deep Dive: USA Rare Earth, Inc.
Period Ending 2026-09-30
|
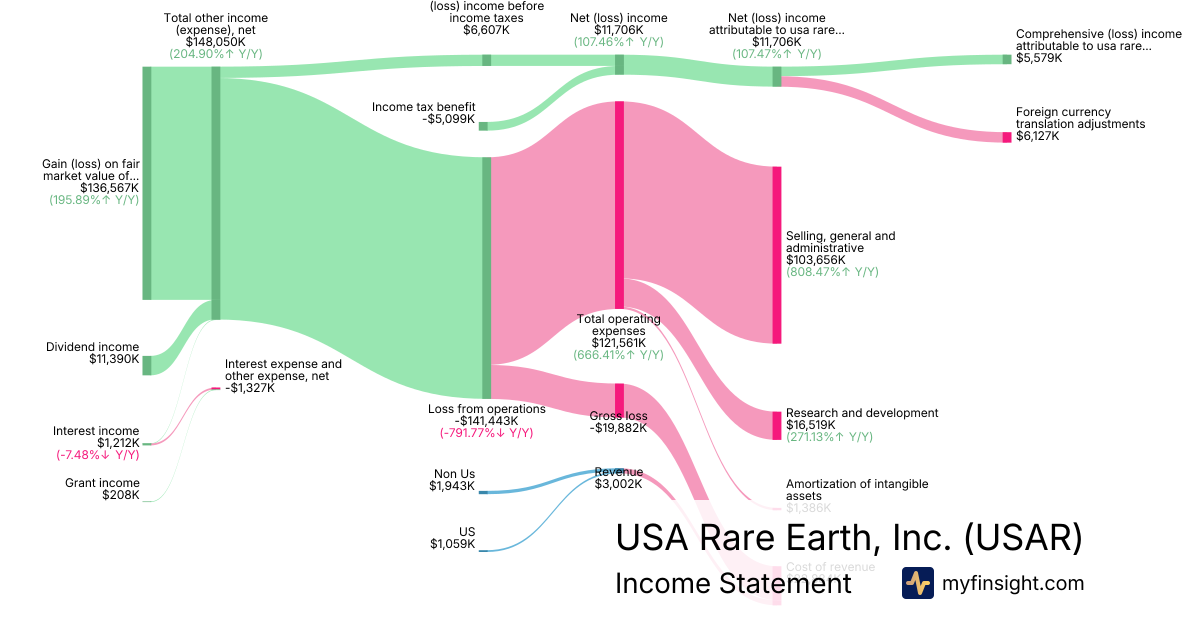
- Reported Net Income Masked by Non-Operating Gains: USA Rare Earth reported a GAAP net income of $11.7 million, a notable positive against prior losses. However, this was primarily driven by a significant non-cash gain of $137 million from the fair market value of financial instruments, as the company simultaneously posted a substantial adjusted net loss of $126 million, or $0.44 per share.
- Weak Operational Performance and Revenue Shortfall: The company recorded a gross loss of -$19.9 million and a loss from operations of -$141 million, with Q3 revenue at $3.0 million falling short of expectations. This was largely due to raw material shortages and increased operating expenses, with gross margin improvement not anticipated until mid-2027.
- Key Strategic Milestones Achieved in Integrated Supply Chain: USAR made significant progress in establishing its integrated rare earth supply chain, including the completion of the Serra Verde acquisition and the commencement of commercial-scale Mixed Rare Earth Carbonate (MREC) shipments, and achieved first commercial sales of NdFeB permanent magnets from its Stillwater facility. The company is targeting an increase in Serra Verde's TREO production to 4,000 tpa by Q2 2027 and 6,400 tpa by end of 2027, and Stillwater's magnet capacity to 1,200 tpa by Q2 2027.
- Strong Cash Position to Fund Growth: The company maintains a robust liquidity position with approximately $1.2 billion in cash, cash equivalents, and restricted cash, providing substantial capital to support its ongoing development and expansion plans for its rare earth assets and manufacturing facilities.
- Project Delays and Qualification Timelines Present Risks: The SK-1300 report for the Round Top project has been delayed to Q3 2027, pushing the final investment decision to the second half of 2027. Additionally, the lengthy customer qualification process for magnets (6 months to 2 years) introduces uncertainty regarding the timing of future full-scale production sales and revenue ramps.
Overall Takeaway
The Q3 2026 earnings call for USAR was broadly neutral, with a cautious outlook. While the company reported a positive GAAP net income, it was heavily reliant on non-operating financial gains, masking significant operational losses and a revenue miss due to raw material shortages. However, USAR made tangible progress on strategic initiatives, including key acquisitions and the commencement of commercial production and sales from its integrated rare earth supply chain, backed by a strong cash position for future growth. The delays in key project reports and lengthy customer qualification timelines present risks that investors should monitor closely.
|
|
Revenue
$3M
|
|
Net Income
$5.58M
|
|
Net Margin
185.84%
|
|
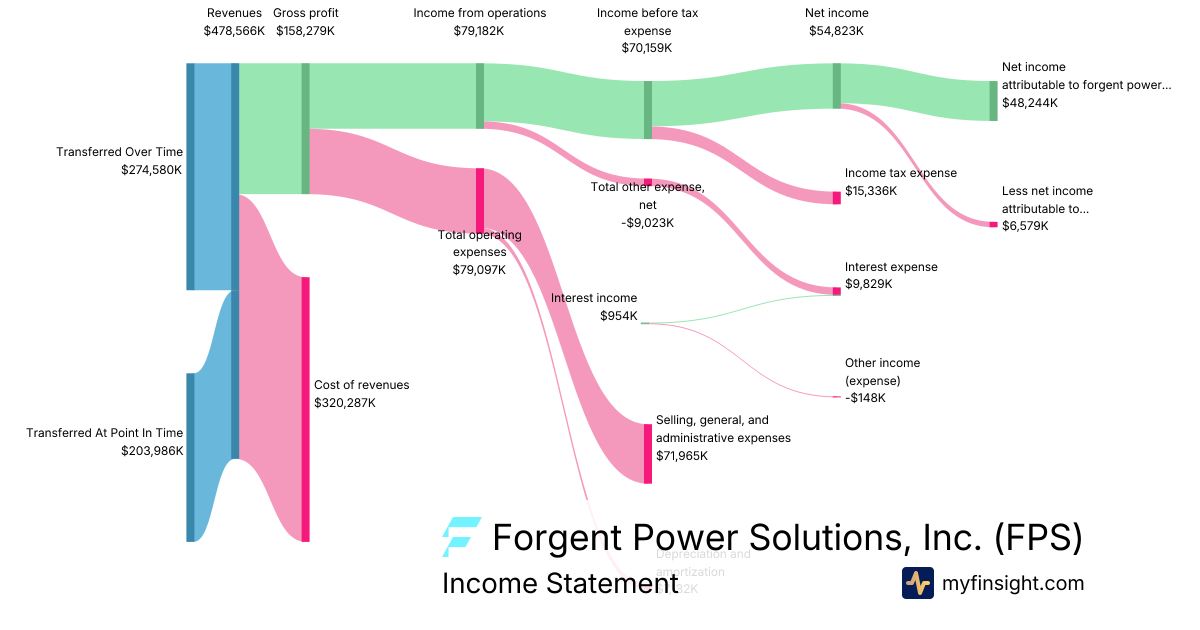
🔍 Deep Dive: Forgent Power Solutions, Inc.
Period Ending 2026-09-30
|
- Record Q1 FY2027 Performance: Forgent Power Solutions (FPS) reported record first-quarter fiscal 2027 revenue of $479 million, a 69% year-over-year increase, exceeding the high end of its guidance range. Adjusted EBITDA rose 61% to $105 million, and adjusted EPS surged 83% to $0.24, reflecting strong operating leverage and lower net interest expense.
- Broad-Based Organic Growth Drivers: Revenue growth was entirely organic and broad-based, with Custom Products increasing 73% to $354 million and Powertrain Solutions growing 62% to $106 million. This growth was driven by sustained demand in data center and industrial end-markets, as well as progress in direct sales to AI labs and hyperscalers.
- Raised Full-Year FY2027 Guidance: FPS raised its full-year fiscal 2027 guidance, now expecting revenue of $2.45 billion–$2.65 billion (80% growth at the midpoint) and adjusted EBITDA of $587 million–$637 million (90% growth). The updated outlook is fully covered by the current backlog, with approximately 40% of the backlog scheduled beyond FY 2027.
- Positive Margin Trajectory and Operational Focus: Management noted that the Q1 adjusted EBITDA margin of 21.9% was ahead of expectations, despite one-time costs related to supporting the Q2 production ramp, and expects sequential margin expansion throughout the year. The company is transitioning to performance optimization, focusing on operating leverage, manufacturing efficiency, and SG&A efficiency.
- Strong Backlog and Cash Flow: The company's year-end backlog grew to over $3 billion (from a prior Q4 2026 result, not in current facts but relevant for context), covering more than 90% of its fiscal 2027 revenue guidance. Cash flow from operations improved significantly to $136 million in Q1, benefiting from higher earnings and favorable timing of customer deposits.
Overall Takeaway
The Q1 fiscal 2027 earnings call for Forgent Power Solutions was broadly positive. The company delivered strong financial results that significantly exceeded guidance, driven by robust demand across its key markets and effective operational execution. The upward revision of full-year guidance and a substantial backlog provide a confident outlook for future growth, despite some investor caution reflected in the immediate stock performance post-announcement.
|
|
Revenue
$479M
|
|
Net Income
$48.2M
|
|
Net Margin
10.08%
|
|
🔍 Deep Dive: Cerebras Systems Inc.
Period Ending 2026-09-30
|
|
🚨 Price Alert: The stock price jumped by 6.42% around the earning call.
|
Cerebras Systems (CBRS) has experienced significant price fluctuations around its recent earnings call, driven by a mixed financial performance that showcased substantial GAAP losses alongside record "Core" revenue and a positive "Core" net income, coupled with an optimistic outlook for its AI-focused cloud services.
Key Factors Contributing to Volatility:
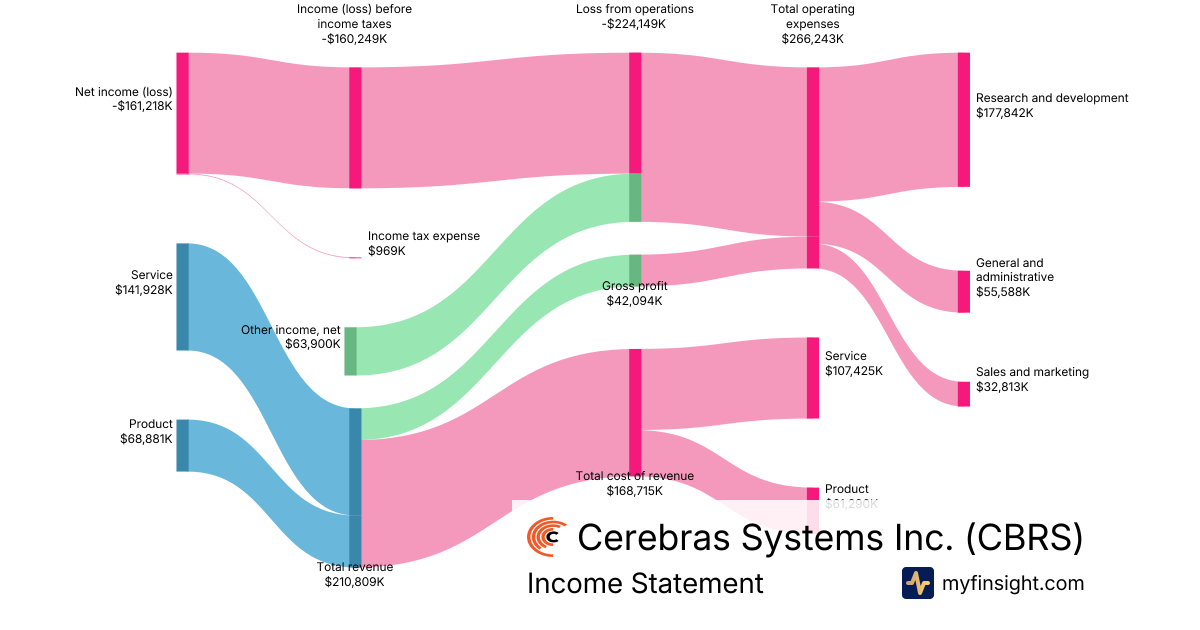
- Mixed Earnings Performance: While the company reported a GAAP net loss of -$161 million and a loss from operations of -$224 million, it simultaneously achieved its first-ever positive Core net income of $30 million and exceeded revenue estimates with $230.9 million in Core revenue. This duality of significant GAAP losses and positive Core metrics has fueled opposing investor sentiments.
- Strong Cloud Services Growth and Future Outlook: Cerebras reported robust growth in its service revenue of $142 million, with core cloud and other services revenue surging 272% year-over-year. Furthermore, the company raised its full-year outlook and anticipates tripling its revenue in 2027, bolstered by new commercial agreements with hyperscalers like Microsoft and Oracle.
- High Operating Expenses and R&D Investments: The company's total operating expenses of $266 million, particularly high research and development expenses of $178 million, significantly outpaced its total revenue of $211 million, contributing to the GAAP operational losses. These substantial investments, while impacting current profitability, are aimed at driving future growth in the competitive AI market.
- Robust Liquidity and Asset Base: Despite ongoing operational losses, Cerebras maintains a strong financial position with significant cash and cash equivalents of $3.07 billion and investments totaling $4.29 billion. This strong liquidity provides a buffer and supports continued investment in its AI technologies.
- Dynamic AI Market and High Stock Volatility: Operating in the high-growth and rapidly evolving AI chipmaker sector, CBRS is inherently prone to volatility. The stock exhibits a high beta coefficient of 5.68 and 10.85% volatility, reflecting investor reactions to its growth prospects, profitability concerns, and broader shifts in AI market sentiment, including analyst price target adjustments and news of an investor investigation.
|
|
Revenue
$211M
|
|
Net Income
-$161M
|
|
Net Margin
-76.48%
|
|
🔍 Deep Dive: AXT INC
Period Ending 2026-09-30
|
|
🚨 Price Alert: The stock price dropped by 8.41% around the earning call.
|
AXT Inc. (AXTI) has experienced considerable price fluctuations recently, primarily driven by a combination of exceptional third-quarter earnings, surging demand for its Indium Phosphide (InP) substrates in the artificial intelligence (AI) data center market, and investor reactions to both growth opportunities and geopolitical risks related to its China operations.
Key Factors Contributing to Volatility:
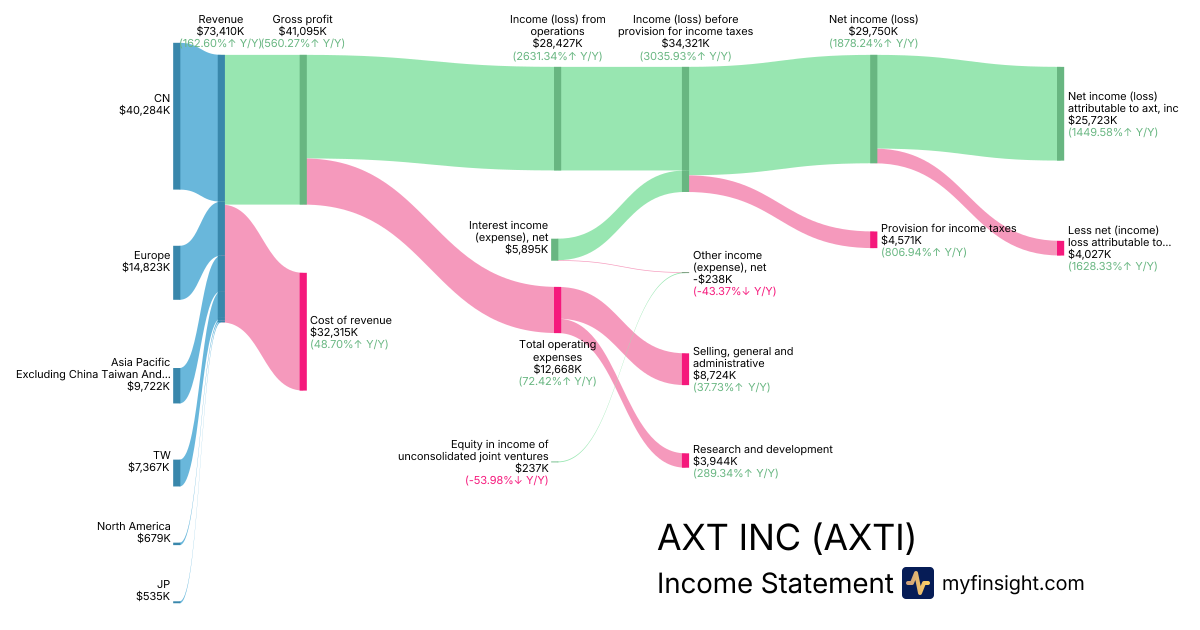
- Record-Breaking Q3 Financials: AXT reported a third-quarter revenue of $73.4 million, marking a 162% year-over-year and 54% sequential increase, significantly surpassing analyst estimates. The company also swung to a $25.7 million profit attributable to AXT, Inc., compared to a loss in the prior year.
- Booming AI Data Center Demand: A significant driver is the accelerating demand for AXT's Indium Phosphide (InP) substrates, which are crucial components for high-speed optical interconnects (such as 800G and 1.6T transceivers) in expanding AI data centers and GPU-dense computing systems.
- Strong Backlog and Capacity Expansion: The company's backlog has exceeded $500 million, with demand for InP outstripping supply and customers reportedly on allocation. AXT has surpassed its 2026 goal of doubling InP capacity and plans further expansion in 2027 to meet this robust demand.
- Strategic Financing and China Exposure: AXT's majority-owned Chinese subsidiary, Beijing Tongmei Xtal Technology, secured private equity financing of $285 million to $545 million for capacity expansion. While this enhances funding, it also introduces volatility due to potential concerns over China manufacturing, export-permit exposure, and the possibility of shareholder dilution if investors exercise redemption rights.
- Market-Wide Volatility and Profit-Taking: Despite strong company-specific news, AXTI's stock has been subject to broader market movements in the highly volatile AI and semiconductor sectors. Sharp rallies have often been followed by significant pullbacks, indicative of profit-taking and re-evaluation of valuation multiples by investors.
|
|
Revenue
$73.4M
|
|
Net Income
$25.7M
|
|
Net Margin
35.04%
|
|
🔍 Deep Dive: X-Energy, Inc.
Period Ending 2026-09-30
|
|
🚨 Price Alert: The stock price jumped by 12.04% around the earning call.
|
X-energy Inc. (XE) has experienced significant price fluctuations around its recent earnings call, primarily driven by a mixed financial performance juxtaposed with notable operational advancements and the long-term nature of its advanced nuclear technology projects.
Key Factors Contributing to Volatility:
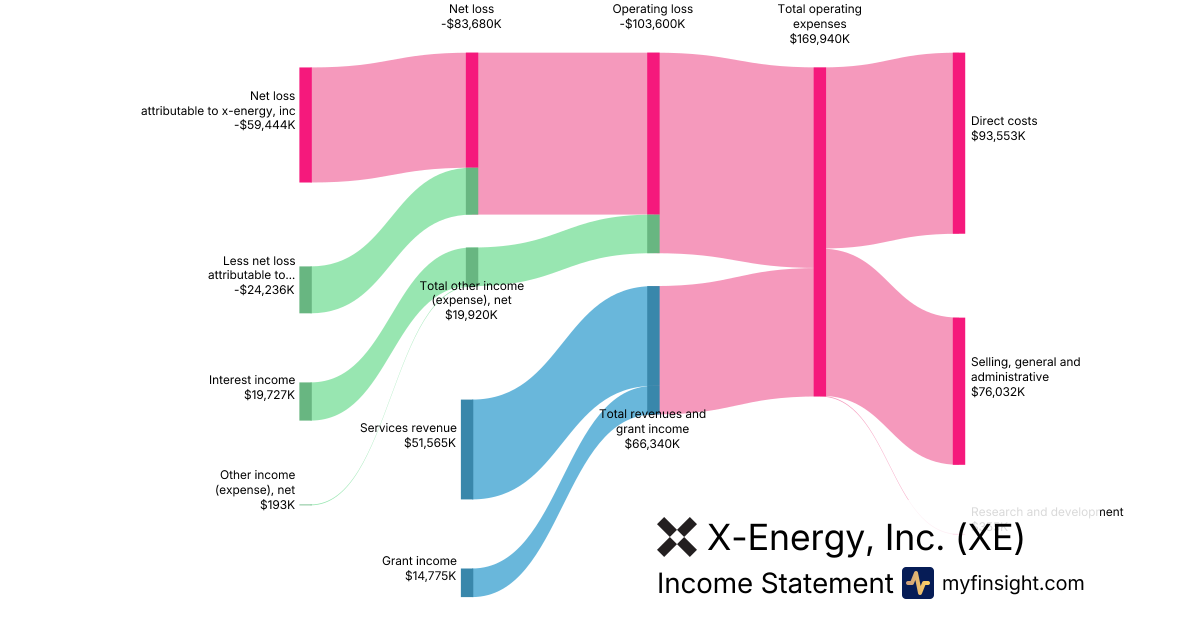
- Revenue Growth Amidst Continued Losses: X-energy reported a substantial 118% year-over-year increase in total revenues and grant income to $66.3 million, largely from services revenue of $51.5 million and grant income of $14.8 million. This growth was fueled by increased project execution under government contracts. However, the company still posted a considerable net loss of -$83.7 million for the quarter, with a net loss attributable to X-energy, Inc. of -$59.4 million.
- Escalating Operating Expenses and Cash Burn: Total operating expenses surged by 139% year-over-year to $170 million, resulting in an operating loss of -$104 million. This significant expenditure reflects heavy investment in the Advanced Reactor Demonstration Program (ARDP), workforce expansion, and core reactor design, leading to increased net cash used in operating activities of -$51.2 million.
- Major Regulatory and Project Milestones: A key positive driver was the Nuclear Regulatory Commission (NRC) issuing a construction permit for Dow's Long Mott project, a significant regulatory achievement for a high-temperature gas-cooled reactor in decades. Additionally, X-energy announced a joint development agreement with American Electric Power (AEP) and Amazon for a 12-unit Xe-100 project, expanding its commercial pipeline.
- Strong Liquidity and Government Support: The company reported a robust balance sheet with $1.04 billion in cash and cash equivalents and no outstanding debt. This strong liquidity is further bolstered by substantial government backing, with $618 million reimbursed to date under the DOE's ARDP, and up to $2.15 billion in total federal funding expected.
- Long-Term Commercialization Horizon and Execution Risk: Despite positive operational news, X-energy remains "pre-revenue on a commercial basis" as its projects have a lengthy development timeline, with the first commercial reactor delivery targeted for the early 2030s. This extended path to commercialization, coupled with inherent execution risks associated with pioneering advanced nuclear technology, contributes to investor uncertainty and stock volatility.
|
|
Revenue
$66.3M
|
|
Net Income
-$59.4M
|
|
Net Margin
-89.61%
|
|
🔍 Deep Dive: Mobility Global Inc.
Period Ending 2026-09-30
|
|
🚨 Price Alert: The stock price jumped by 16.88% around the earning call.
|
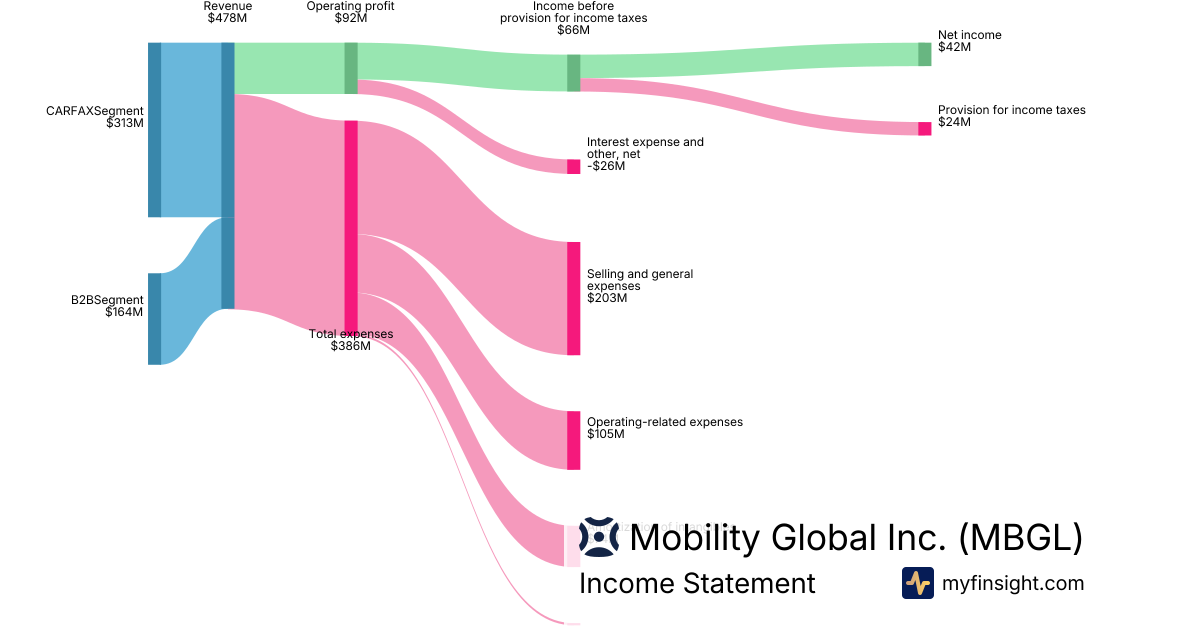
Mobility Global (MBGL) has experienced notable price fluctuations around its recent earnings call, driven by a combination of strong underlying revenue growth and optimistic future guidance, tempered by a significant decline in GAAP net income due to one-time costs and debt-related interest expenses. Positive sentiment was also fueled by share repurchase authorizations.
Key Factors Contributing to Volatility:
- Divergent Profitability Metrics: While Mobility Global reported robust $478 million in revenue, representing a 7.4% year-over-year increase, its GAAP net income significantly declined by 41% to $42 million. This decline was primarily attributed to one-time separation costs and an estimated $26 million in bond interest expense, even as adjusted EPS exceeded expectations.
- Solid Operating Performance & Upgraded Outlook: The company reported a healthy $92 million operating profit and, importantly, raised the midpoint of its 2026 adjusted EBITDA guidance to $755 million, signaling positive expectations for future profitability.
- Shareholder Return Initiatives: The authorization of an $800 million share repurchase program and the declaration of a quarterly dividend of $0.06 per share likely contributed to positive investor sentiment.
- Significant Intangible Assets and Long-Term Debt: MBGL's balance sheet reveals a substantial portion of its $13.2 billion total assets is comprised of $8.85 billion in goodwill and $3.57 billion in other intangible assets, alongside $1.98 billion in long-term debt, which can introduce both growth potential and inherent risks such as future impairment charges or financial leverage concerns.
- Standalone Public Company Transition: As this marked Mobility Global's first full quarter operating as a standalone public entity, the impact of new operating costs and ongoing transitional expenses (including approximately $100 million in non-recurring costs) likely influenced investor assessment and subsequent stock price movements.
|
|
Revenue
$478M
|
|
Net Income
$42M
|
|
Net Margin
8.79%
|
|
🔍 Deep Dive: Johnson Controls International plc
Period Ending 2026-09-30
|
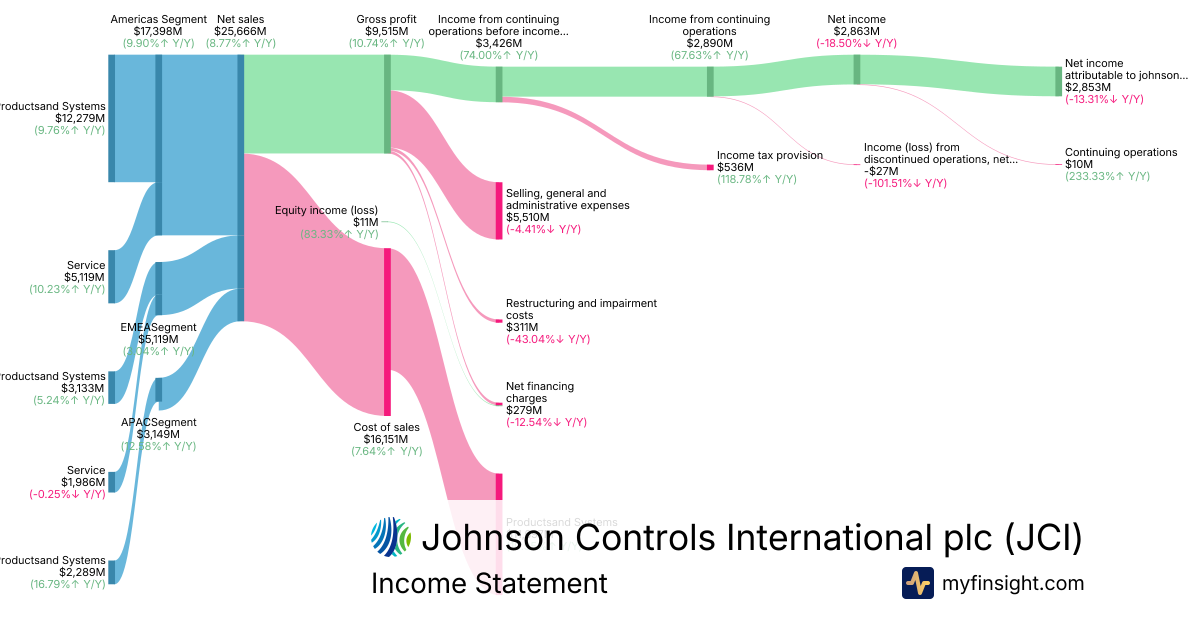
- Strong Q4 and Full-Year Financial Performance: Johnson Controls delivered robust fiscal Q4 2026 results with 12% organic revenue growth and adjusted EPS of $1.66, exceeding consensus estimates. For the full fiscal year 2026, the company reported $25.7 billion in net sales, over 8% organic revenue growth, and a 37% increase in adjusted EPS to $5.16. Adjusted EBIT margin expanded 300 basis points in Q4 to 18.3%, demonstrating significant operating leverage.
- Record Backlog and Data Center Demand as Key Growth Drivers: A record $23 billion backlog, up 43% organically, highlights strong future revenue visibility, significantly driven by surging demand for data center infrastructure and other mission-critical facilities. Organic orders surged 44% in Q4, with the Americas segment showing strong performance and applied HVAC products experiencing a 20% surge due to robust data center demand.
- Positive Fiscal 2027 Guidance: Management initiated an optimistic fiscal 2027 outlook, forecasting organic revenue growth of 11% to 12% and adjusted earnings per share of $6.15 to $6.30, representing 19% to 22% growth from fiscal 2026. The company also expects approximately 95% adjusted free cash flow conversion, even with increased capital expenditures.
- Strategic Restructuring and Capacity Investment: Johnson Controls is strategically transforming into a focused thermal technology leader, prioritizing AI-driven data centers, and plans approximately $900 million in capital expenditures for fiscal 2027 to expand manufacturing capacity. A new restructuring program is underway, anticipating around $400 million in expenses over fiscal 2027 and 2028, aiming for $600 million in gross annualized savings by fiscal 2029. Current $311 million in restructuring and impairment costs are noted.
- Solid Balance Sheet and Shareholder Returns: The company maintained a strong financial position, with net debt declining and the net debt-to-adjusted EBITDA ratio improving to 1.8x. Long-term debt stood at $7.53 billion. Johnson Controls returned $2.5 billion to shareholders in fiscal 2026 through share repurchases and dividends. Cash and cash equivalents were $618 million.
Overall Takeaway
The Q4 fiscal 2026 earnings call was broadly positive. Johnson Controls demonstrated strong financial performance, exceeding expectations for both the quarter and the full year, driven by significant demand in mission-critical markets like data centers. The record backlog and ambitious fiscal 2027 guidance, coupled with strategic investments in capacity and a restructuring program aimed at long-term savings, signal confidence in continued growth and improved profitability, despite ongoing geopolitical uncertainties in some regions.
|
|
Revenue
$25.7B
|
|
Net Income
$2.85B
|
|
Net Margin
11.12%
|
|
🔍 Deep Dive: ROCKWELL AUTOMATION, INC
Period Ending 2026-09-30
|
|
🚨 Price Alert: The stock price dropped by 8.94% around the earning call.
|
Rockwell Automation (ROK) recently experienced significant price volatility around its Q4 fiscal 2026 earnings call on November 5, 2026, driven by a combination of mixed financial results, a strong but cautious outlook, and broader market dynamics. While the company reported a robust adjusted earnings beat and impressive margin expansion, concerns over revenue shortfalls and slowing annual recurring revenue (ARR) growth contributed to the fluctuations. The market also weighed Rockwell's strategic advancements in AI and digital transformation against its valuation and macroeconomic headwinds.
Key Factors Contributing to Volatility:
- Mixed Q4 Fiscal 2026 Performance: Rockwell Automation reported adjusted earnings per share of $3.88, a 16% increase year-over-year, significantly beating analyst expectations. The company also achieved a 24.5% enterprise operating margin, reaching its long-term target three years early. However, reported revenue of $2.33 billion was essentially flat year-over-year and fell below consensus estimates. The impact of tariff refunds, which reduced reported sales by approximately $85 million but boosted adjusted EPS by $0.11, further complicated the interpretation of results.
- Annual Recurring Revenue (ARR) Growth Below Expectations: Organic ARR grew 5% in fiscal 2026, missing management's earlier high-single-digit target. This was identified as a key investor concern, suggesting potential challenges in the company's efforts to expand its recurring revenue streams, despite strong organic sales growth of 15% in the Software & Control segment.
- Positive FY2027 Outlook Counterbalanced by Valuation: The company provided a strong fiscal 2027 guidance, forecasting 6% to 9% organic sales growth and adjusted EPS of $14.50 to $15.50, driven by robust demand in high-growth areas like semiconductor and data center (AI infrastructure) markets. However, some analyses indicated the stock was "modestly overvalued" with a trailing Price/Earnings ratio of 36.11x, slightly above its five-year median, which may have tempered investor enthusiasm despite the optimistic outlook.
- Strategic Focus on AI and Digital Transformation: Rockwell's strategic initiatives, including the unveiling of its AI-native FactoryTalk Conductor platform and added NVIDIA Nemotron support, reinforced its digital transformation narrative. This positioned the company as a beneficiary of growing AI infrastructure investments, with semiconductor sales rising almost 50%. However, this AI linkage also exposed the stock to broader "AI-driven risk-off selloffs" in the market.
- Broader Market and Macroeconomic Headwinds: General market caution stemming from rising interest rates, inflationary pressures, and geopolitical tensions continued to exert pressure on industrial technology stocks like ROK. These macroeconomic factors contributed to volatility, influencing investor sentiment beyond company-specific news.
|
|
Revenue
$8.99B
|
|
Net Income
$1.41B
|
|
Net Margin
15.67%
|
|
🔍 Deep Dive: STARBUCKS CORP
Period Ending 2026-09-27
|
- Strong Financial Performance & Strategic Shift: Starbucks reported a strong fiscal 2026, with full-year consolidated net revenues growing 2.1% to $37.9 billion, and full-year EPS increasing approximately 27% to $2.72, exceeding guidance. The "Back to Starbucks" strategy is now considered a growth plan, moving beyond its initial turnaround phase.
- Robust Comparable Store Sales & Margin Expansion: The company achieved its fifth consecutive quarter of positive global comparable store sales growth, reaching 7.2% in Q4 2026, with U.S. comps up 7.7%. Consolidated operating margin expanded 450 basis points to 14% in Q4, marking the third consecutive quarter of margin growth.
- Impact of China Transition & International Growth: Q4 consolidated net revenues declined 3.9% year-over-year to $9.1 billion, primarily due to the mid-year transition of the China business to a licensed model. Despite this, the company plans approximately 1,200 net new coffeehouses globally in fiscal 2027, with about 1,100 internationally and China contributing roughly half of those.
- Significant Restructuring Costs: Starbucks incurred $689 million in restructuring and impairments for the fiscal year, with $584 million related to the Fiscal Year 2026 Restructuring Plan. This included $436 million in the North America segment and $51.5 million in the International segment.
- Positive FY2027 Outlook & Shareholder Returns: For fiscal 2027, management expects North America comparable sales to grow approximately 4%, consolidated operating margin between 13.5% and 14%, and EPS of $3.15 to $3.25. The company also increased its dividend and plans to resume share repurchases in fiscal 2027, underscoring confidence in long-term value.
Overall Takeaway
The Q4 Fiscal Year 2026 earnings call for Starbucks was broadly positive. Despite a reported revenue decline in Q4 primarily influenced by the strategic licensing transition in China, the company demonstrated strong comparable store sales growth and significant operating margin expansion, exceeding EPS guidance. Management's forward-looking guidance for fiscal 2027, combined with increased shareholder returns and the evolution of the "Back to Starbucks" plan into a growth strategy, signals continued confidence in future performance.
|
|
Revenue
$37.9B
|
|
Net Income
$2.53B
|
|
Net Margin
6.66%
|
|
This newsletter is sent from
MyFinsight.com.
Was this email forwarded to you? Sign up here.
Unsubscribe
Copyright © 2026 MyFinsight, All rights reserved.
|